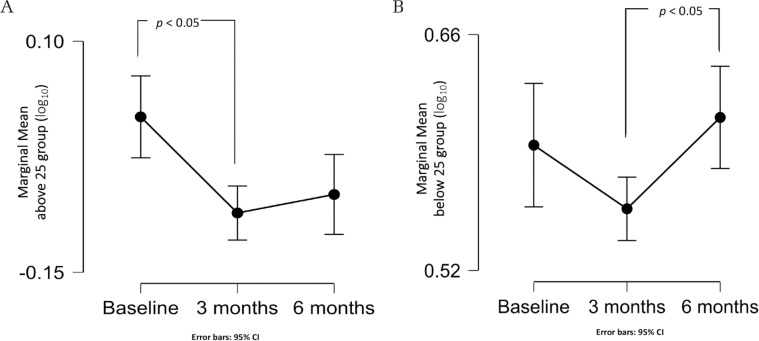
Fig. 2.
(A) Line graph showing the marginal mean of the tumor volume (log10) measurement in the ‘above 25’ group, with a significant difference between the baseline and 3rd month values. (B) Line graph showing the marginal mean of the tumor volume (log10) measurement in the ‘below 25’ group, showing a significant difference between the 3rd and the 6th month values.

