Figure 1.

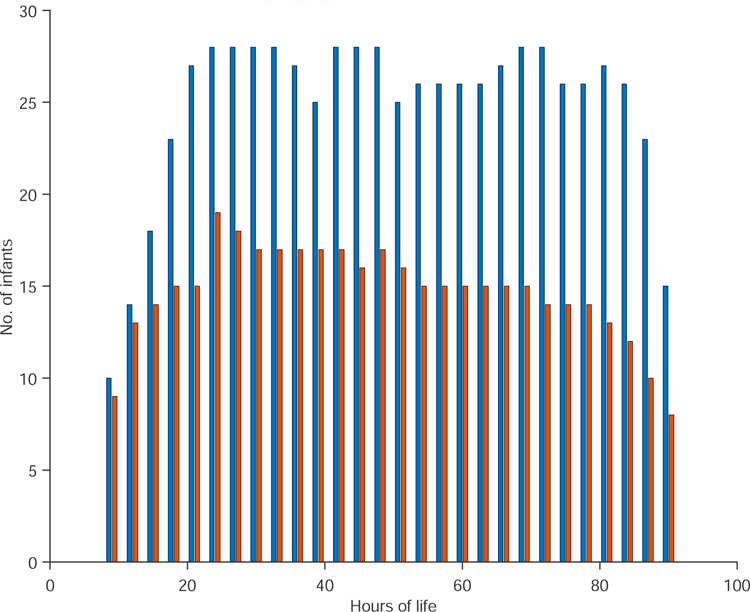
(Color online) Histogram of the number of infants compared in every 3-hour epoch. The good outcome group is shown in blue bar and the adverse outcome group in red bar. This distribution is the same for all three epoch lengths.

(Color online) Histogram of the number of infants compared in every 3-hour epoch. The good outcome group is shown in blue bar and the adverse outcome group in red bar. This distribution is the same for all three epoch lengths.