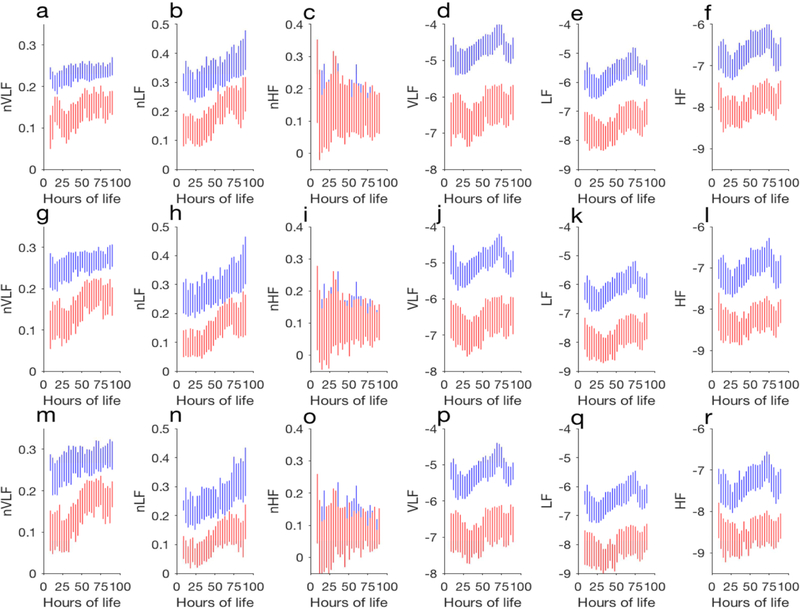
Figure 2.
(color online) Summary of HRV metrics in every 3 hours. In each plot, mean plus standard deviation of the spectral power of the good outcome group and mean minus standard deviation of the spectral power of the adverse outcome group are shown. The spectral metrics from two-minute analysis are shown in a) nVLF, b) nLF, c) nHF, d)VLF, e) LF, and f) HF. The results shown in g-i, and m-r are the same as shown in a-f but obtained for five-minute and ten-minute analyses, respectively.

