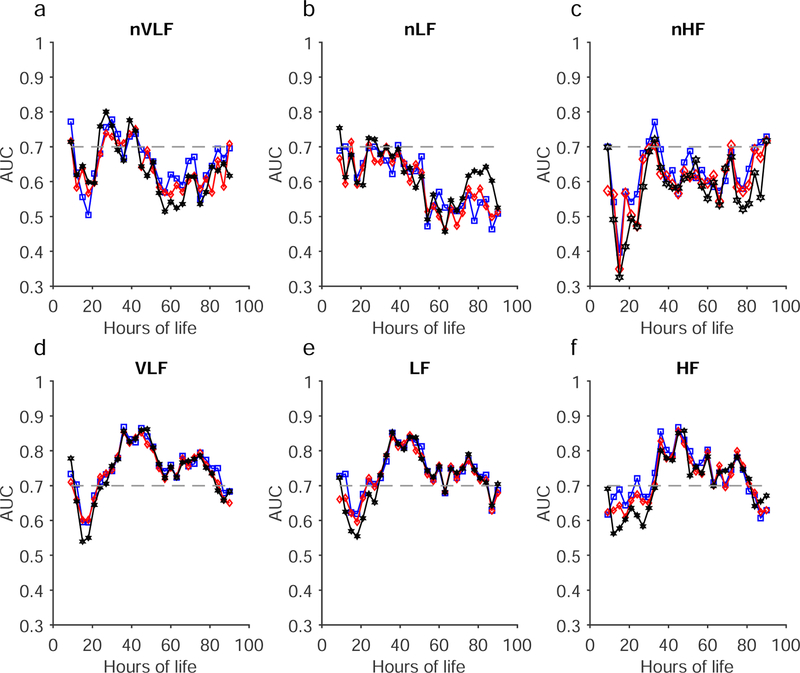
Figure 3.
(Color online) The area under the ROC curve (AUC) obtained from the six spectral metrics are shown as a function of hours of life. a) normalized very low-frequency (nVLF), b) normalized low-frequency (nLF), c) normalized high-frequency (nHF), d) very low-frequency (VLF), e) low-frequency (LF), and f) high-frequency (HF). The results from two-, five-, and ten-minute analyses are shown in blue, red, and black, respectively. The horizontal dashed line at AUC=0.7 is a reference line.

