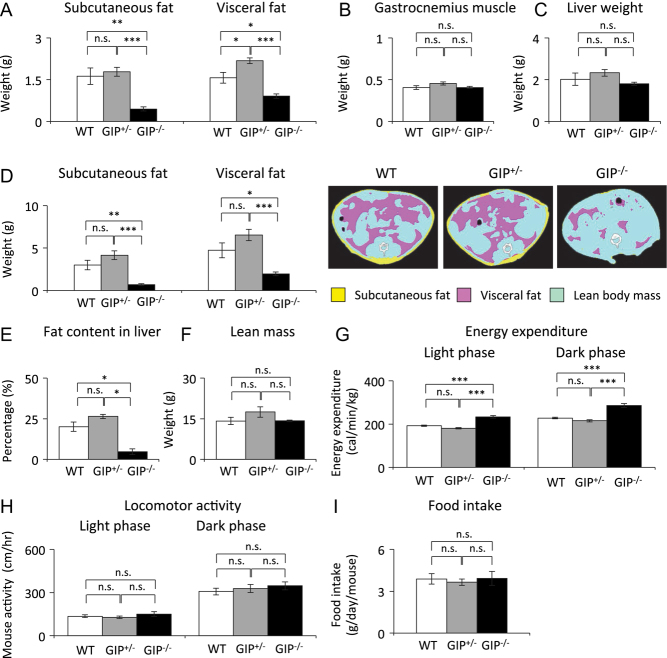
Figure 2.
Body composition, energy expenditure, locomotor activity, and food intake in GIP−/− and GIP+/− mice. (A) Subcutaneous and visceral fat weight, (B) gastrocnemius muscle weight, and (C) liver weight in 60-week-old mice (n = 5−6). (D) Subcutaneous and visceral fat mass, (E) lean mass, and (F) fat content in liver estimated by CT scan in 58-week-old mice (n = 5–6). Pink, yellow, and blue areas represent visceral fat, subcutaneous fat, and lean mass, respectively. (G) Energy expenditure in 51-week-old mice (n = 6). (H) Locomotor activity in 54-week-old mice (n = 6). (I) Food intake in 52-week-old mice (n = 6). WT mice (white bars), GIP+/− mice (gray bars), and GIP−/− mice (black bars). *P < 0.05, **P < 0.01, ***P < 0.001. n.s., no significant difference.

 This work is licensed under a