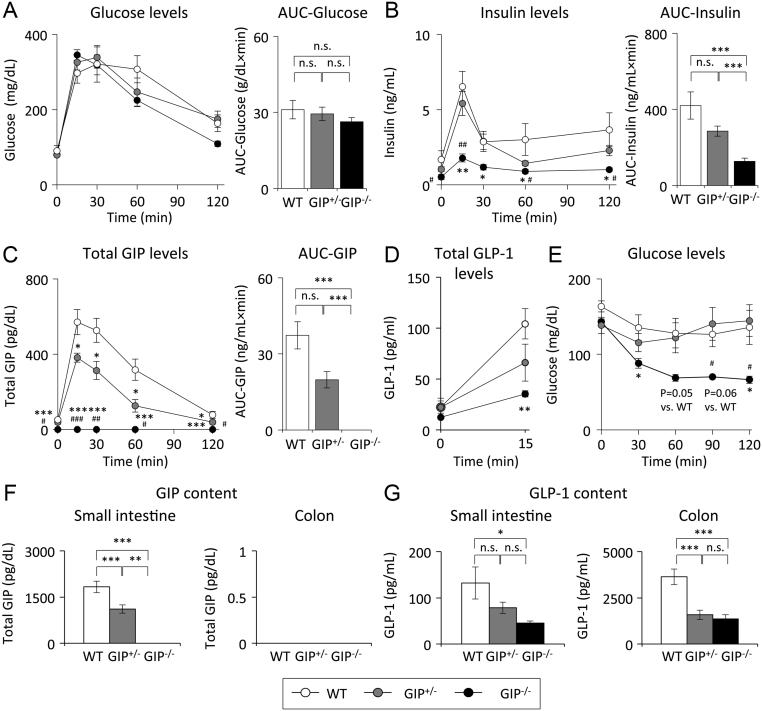
Figure 3.
Oral glucose tolerance test (OGTT) and insulin tolerance test (ITT). (A) Blood glucose levels, (B) insulin levels, and (C) total GIP levels during OGTT (2 g glucose/kg body weight) in 52-week-old mice (n = 6). (D) Total GLP-1 levels during OGTT (6 g glucose/kg body weight) in 54 weeks old mice (n = 6). (E) Blood glucose levels during ITT (0.75 U insulin/kg body weight) in 54 weeks old mice. (F) GIP content in small intestine and colon in GIP−/− and GIP+/− in 54 weeks old mice (n = 6). (G) GLP-1 content in small intestine and colon in GIP−/− and GIP+/− in 54 weeks old mice (n = 6). WT mice (white bars and circles), GIP+/− mice (gray bars and circles), and GIP−/− mice (black bars and circles). *P < 0.05, **P < 0.01, ***P < 0.001 vs WT mice. #P < 0.05, ##P < 0.01, ###P < 0.001 vs GIP+/− mice. n.s., no significant difference. AUC, area under the curve.

 This work is licensed under a