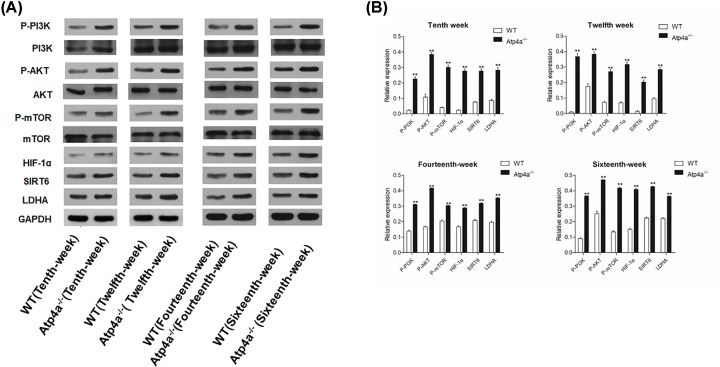
Figure 7. The expression of glucose metabolism-related protein in gastric mucosa in Atp4a−/−mice.
(A) Western blot analysis of apoptosis in the Atp4a−/− mice. (B) The quantification of the band intensities is presented in the adjacent graphs. Data are shown as the mean ± SEM (n=6 mice per group). *P<0.05 and **P<0.01 versus the WT group.

