Figure 3.
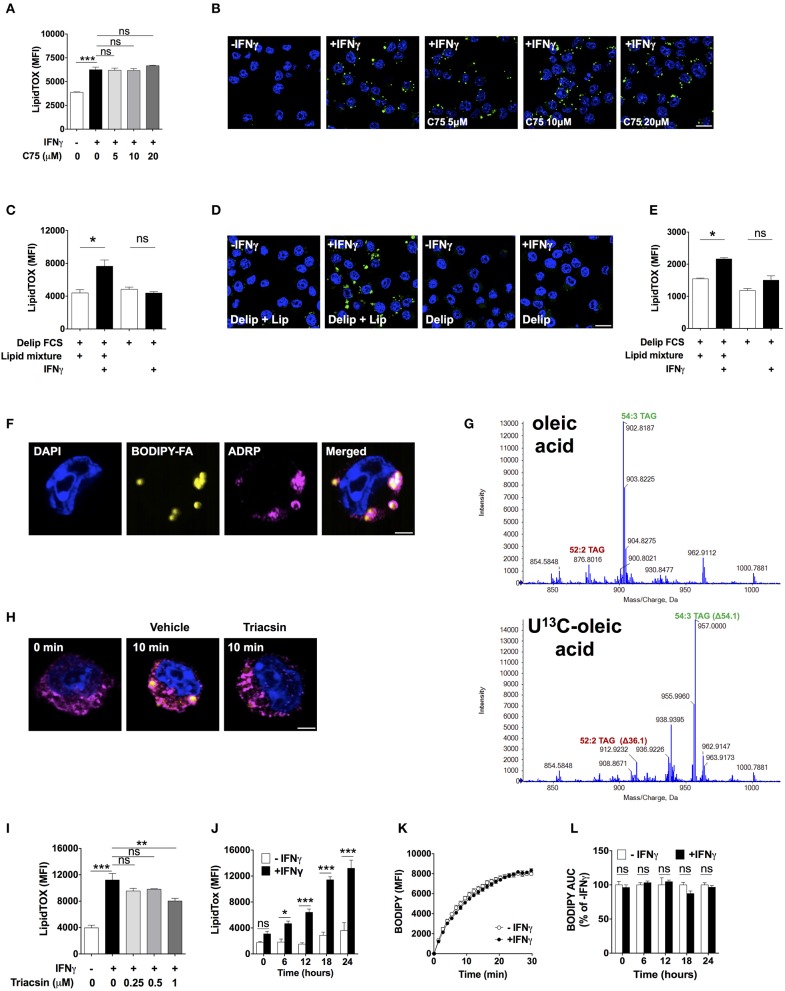
Lipid droplet accumulation induced by IFNγ is dependent on exogenous lipids not de novo fatty acid synthesis. (A) LipidTOX MFI and (B) confocal fluorescence image of Maf-DKO macrophages activated with IFNγ and incubated in the absence or presence of indicated concentrations of C75. Data shown as mean ± SEM of three replicates. Data is representative of three experiments. Scale bar 12.5 μm. (C) LipidTOX MFI and (D) confocal fluorescence image of Maf-DKO macrophages incubated in the presence or absence of IFNγ in medium containing delipidated (Delip) FCS, or delipidated FCS plus lipid mixture. Data shown as mean ± SEM of three replicates. Data is representative of three experiments. Scale bar 12.5 μm. (E) LipidTOX MFI of bone marrow-derived macrophages incubated in the presence or absence of IFNγ in medium containing delipidated (Delip) FCS, or delipidated FCS plus lipid mixture. Data shown as mean ± SEM of three replicates. Data is representative of two experiments. (F) Confocal fluorescence image of cells activated with IFNγ for 24 h in medium containing delipidated serum and BODIPY-fatty acid; scale bar 2.5 μm. Cells were stained with DAPI and anti-ADRP antibody. (G) ToF-MS profile of TAG extracted from macrophages activated in medium containing unlabeled or U-13C oleic acid. Note a mass shift of 36 and 54 in 52:2 TAG and 54:3 TAG, respectively, corresponding to incorporation of 2 or 3 oleic-acid chains into TAG. Data is from a single experiment. (H) Confocal fluorescence image of cells before and after 10 min incubation with delipidated serum and BODIPY-fatty acid. Cells were previously activated with IFNγ for 24 h followed by a 30 min incubation with triacsin (1 μM). Yellow, BODIPY-fatty acid; magenta, ADRP; scale bar 2.5 μm. Image is representative of two experiments. (I) LipidTOX MFI of cells activated with IFNγ in the presence of indicated concentrations of triacsin. Data shown as mean ± SEM of three replicates. Data is representative of two experiments. (J) LipidTOX MFI of cells incubated with or without IFNγ for different time periods. (K) BODIPY-fatty acid incorporation into cells measured over 30 min. (L) Area under the curve of BODIPY-fatty acid incorporation of cells incubated in the presence or absence of IFNγ for the indicated time periods. Data shown as mean ± SEM of five replicates. Data is representative of two experiments. ns, not significant; *p < 0.05; **p < 0.01; ***p < 0.001.

