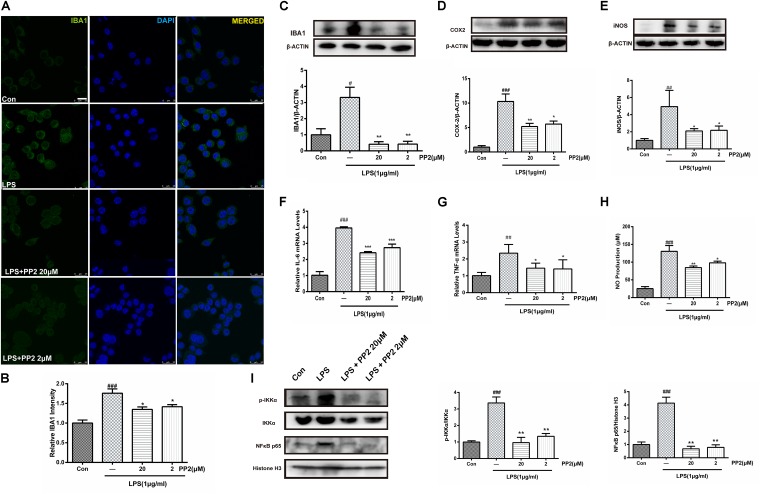
FIGURE 2.
Src inhibition prevented the activation of BV2 microglia and the production of neuroinflammatory molecules subjected to lipopolysaccharide (LPS). (A) Cultured BV2 cells were treated with two concentrations of PP2 (2 and 20 μM) in the presence of LPS (1 μg/ml) for 24 h, and then the cells were stained with anti-IBA1 antibody (green) and DAPI stain (scale bar: 8 μm). (B) Quantification of the IBA1 staining was provided in a histogram. Each bar represents the mean ± SEM. n = 4. ###P < 0.001 vs. control group, *P < 0.05 vs. LPS group. (C) BV2 cells were treated with two concentrations of PP2 (2 and 20 μM) in the presence of LPS (1 μg/ml) for 24 h. The protein level of IBA1 was analyzed by western blot with anti-IBA1 antibody. β-Actin was used as an internal loading control. Each bar represents the mean ± SEM. n = 4. #P < 0.05 vs. control group,**P < 0.01 vs. LPS group. (D,E) The protein level of cyclooxygenase-2 (COX2) and iNOS were examined by western blot. Each bar represents the mean ± SEM. n = 4. ###P < 0.001 and ##P < 0.01 vs. control group, **P < 0.01 and *P < 0.05 vs. LPS group. (F,G) The mRNA levels of IL-6 and TNF-α were analyzed by quantitative reverse transcription (qRT)-PCR. Each bar represents the mean ± SEM. n = 4. ##P < 0.01 and ###P < 0.001 vs. control group, *P < 0.05 and ***P < 0.001 vs. LPS group. (H) The level of NO production was determined using the Griess reaction. Each bar represents the mean ± SEM. n = 5. ###P < 0.001 vs. control group, *P < 0.05 and **P < 0.01 vs. LPS group. (I) The protein expression level of p-IKKα, IKKα, NF-κB p65, and histone H3 were measured by western blot. Each bar represents the mean ± SEM. n = 4. ###P < 0.001 vs. control group, **P < 0.01 vs. LPS group.

