FIGURE 5.
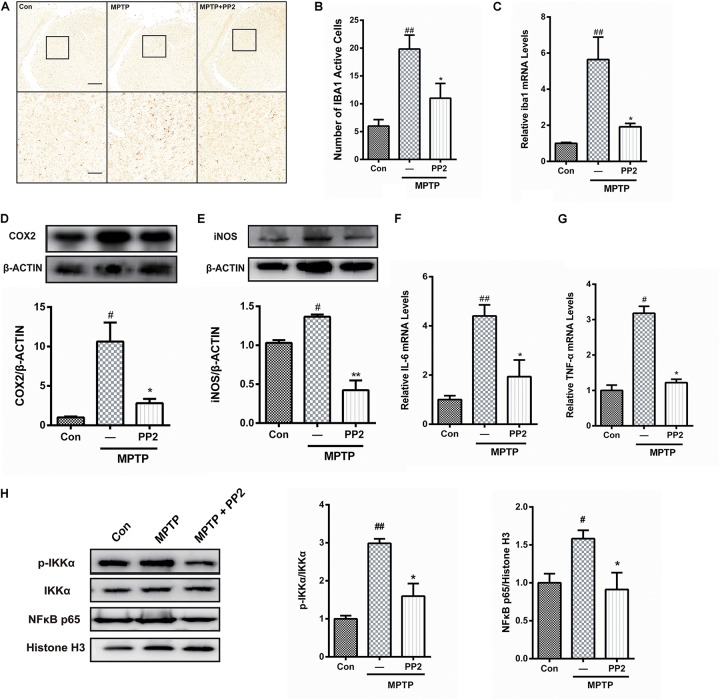
Src inhibition reduced activation of microglial cells and neuroinflammation in 1-methyl-4-phenyl-1,2,3,6-tetrahydropyridine (MPTP)-treated mice. (A) The activation of microglia in SNpc showed by IBA1 immunostaining (scale bar: top, 200 μm; bottom, 50 μm). (B) The number of IBA1-positive cells per 100 cells was counted and provided in a histogram. Data are expressed as means ± SEM. n = 4. ##P < 0.01 vs. control group,*P < 0.05 vs. lipopolysaccharide (LPS) group. (C) The mRNA expression level of IBA1 in SNpc was determined by quantitative reverse transcription (qRT)-PCR. Data are expressed as means ± SEM. n = 4. ##P < 0.01 vs. control group,*P < 0.05 vs. LPS group. (D,E) The protein expression level of cyclooxygenase-2 (COX2) and iNOS were determined by western blot with anti-COX2 and anti-iNOS antibodies. Data are expressed as means ± SEM. n = 4. #P < 0.05 vs. control group,*P < 0.05 and **P < 0.01 vs. LPS group. (F,G) The mRNA expression level of IL-6 and TNF-α was determined by qRT-PCR. Each bar represents the mean ± SEM. n = 4. #P < 0.05 and ##P < 0.01 vs. control group, *P < 0.05 vs. MPTP group. (H) The protein expression level of p-IKKα, IKKα, NF-κB p65, and histone H3 were measured by western blot. Each bar represents the mean ± SEM. n = 4. #P < 0.05 and ##P < 0.01 vs. control group, *P < 0.05 vs. MPTP group.

