
Figure 2.
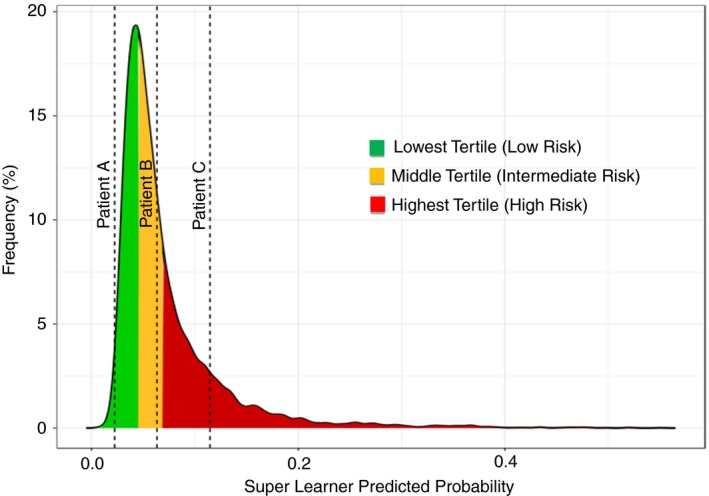
Predicted risk distributions. This figure shows the distribution of the predicted risks produced by the rML model. The distribution is divided into tertiles, with the green area representing low risk of VTE, the yellow represents intermediate risk for VTE, and the red represents high risk for VTE. VTE, venous thromboembolism