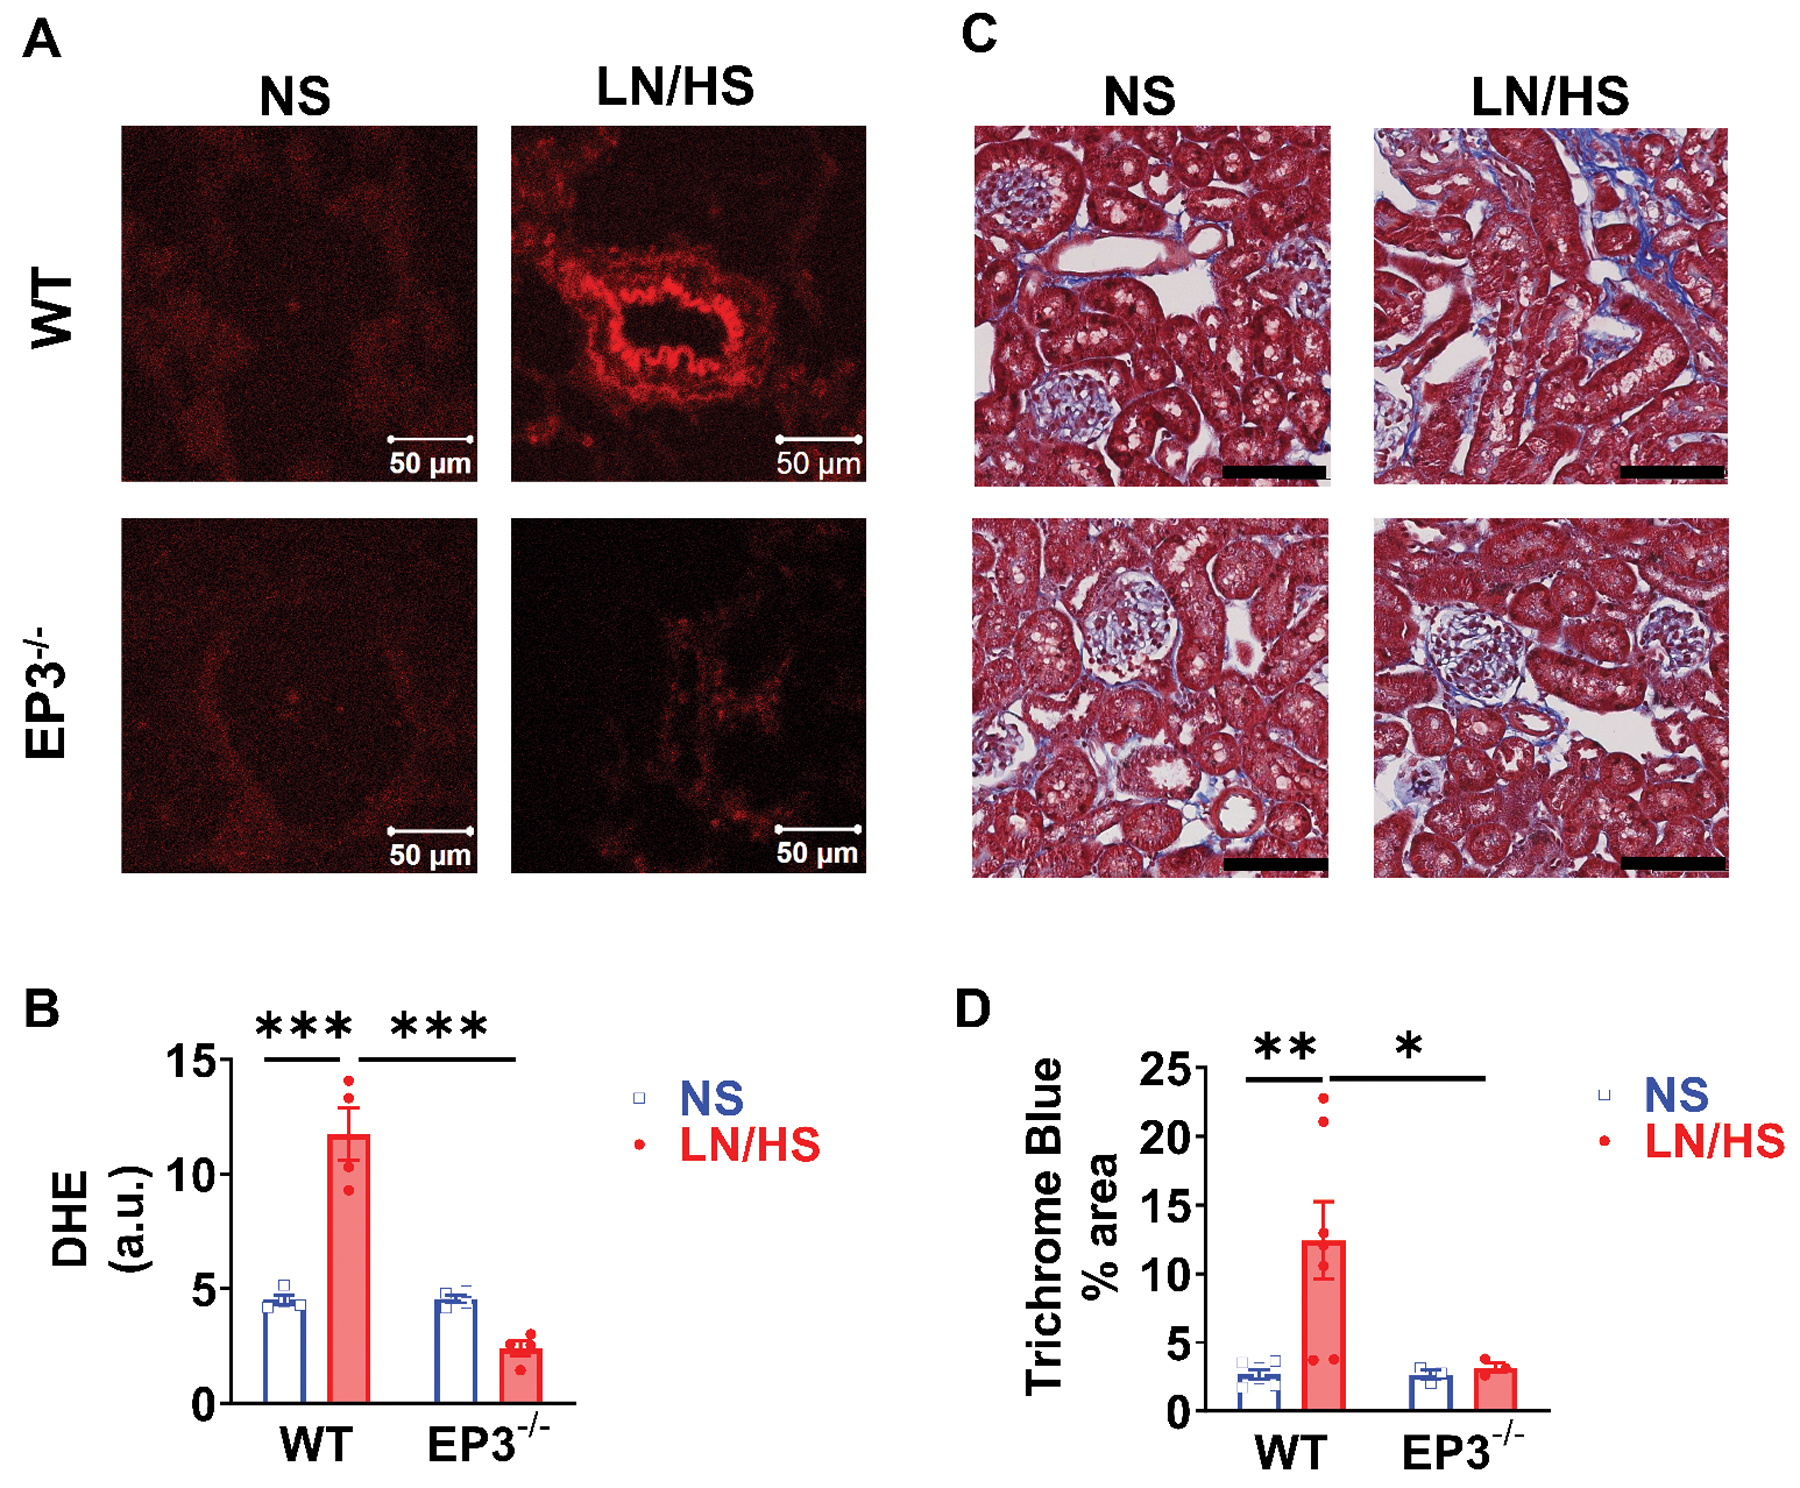
Figure 2:

Effects of EP3 deficiency on renal oxidative stress and renal fibrosis in response to L-NAME/high salt (LN/HS) induced hypertension. DHE fluorescence was visualized at 530 nm to 560 nm and relative fluorescence intensity was quantified in (A) and (B). Collagen was identified using Masson’s trichrome blue stain and quantified in (C) and (D). Data were analyzed using 2-way ANOVA and post-hoc multiple comparisons. *P<0.05, **P<0.01, n= 4 to 8 in each group. Black lines denote 100 μm.
