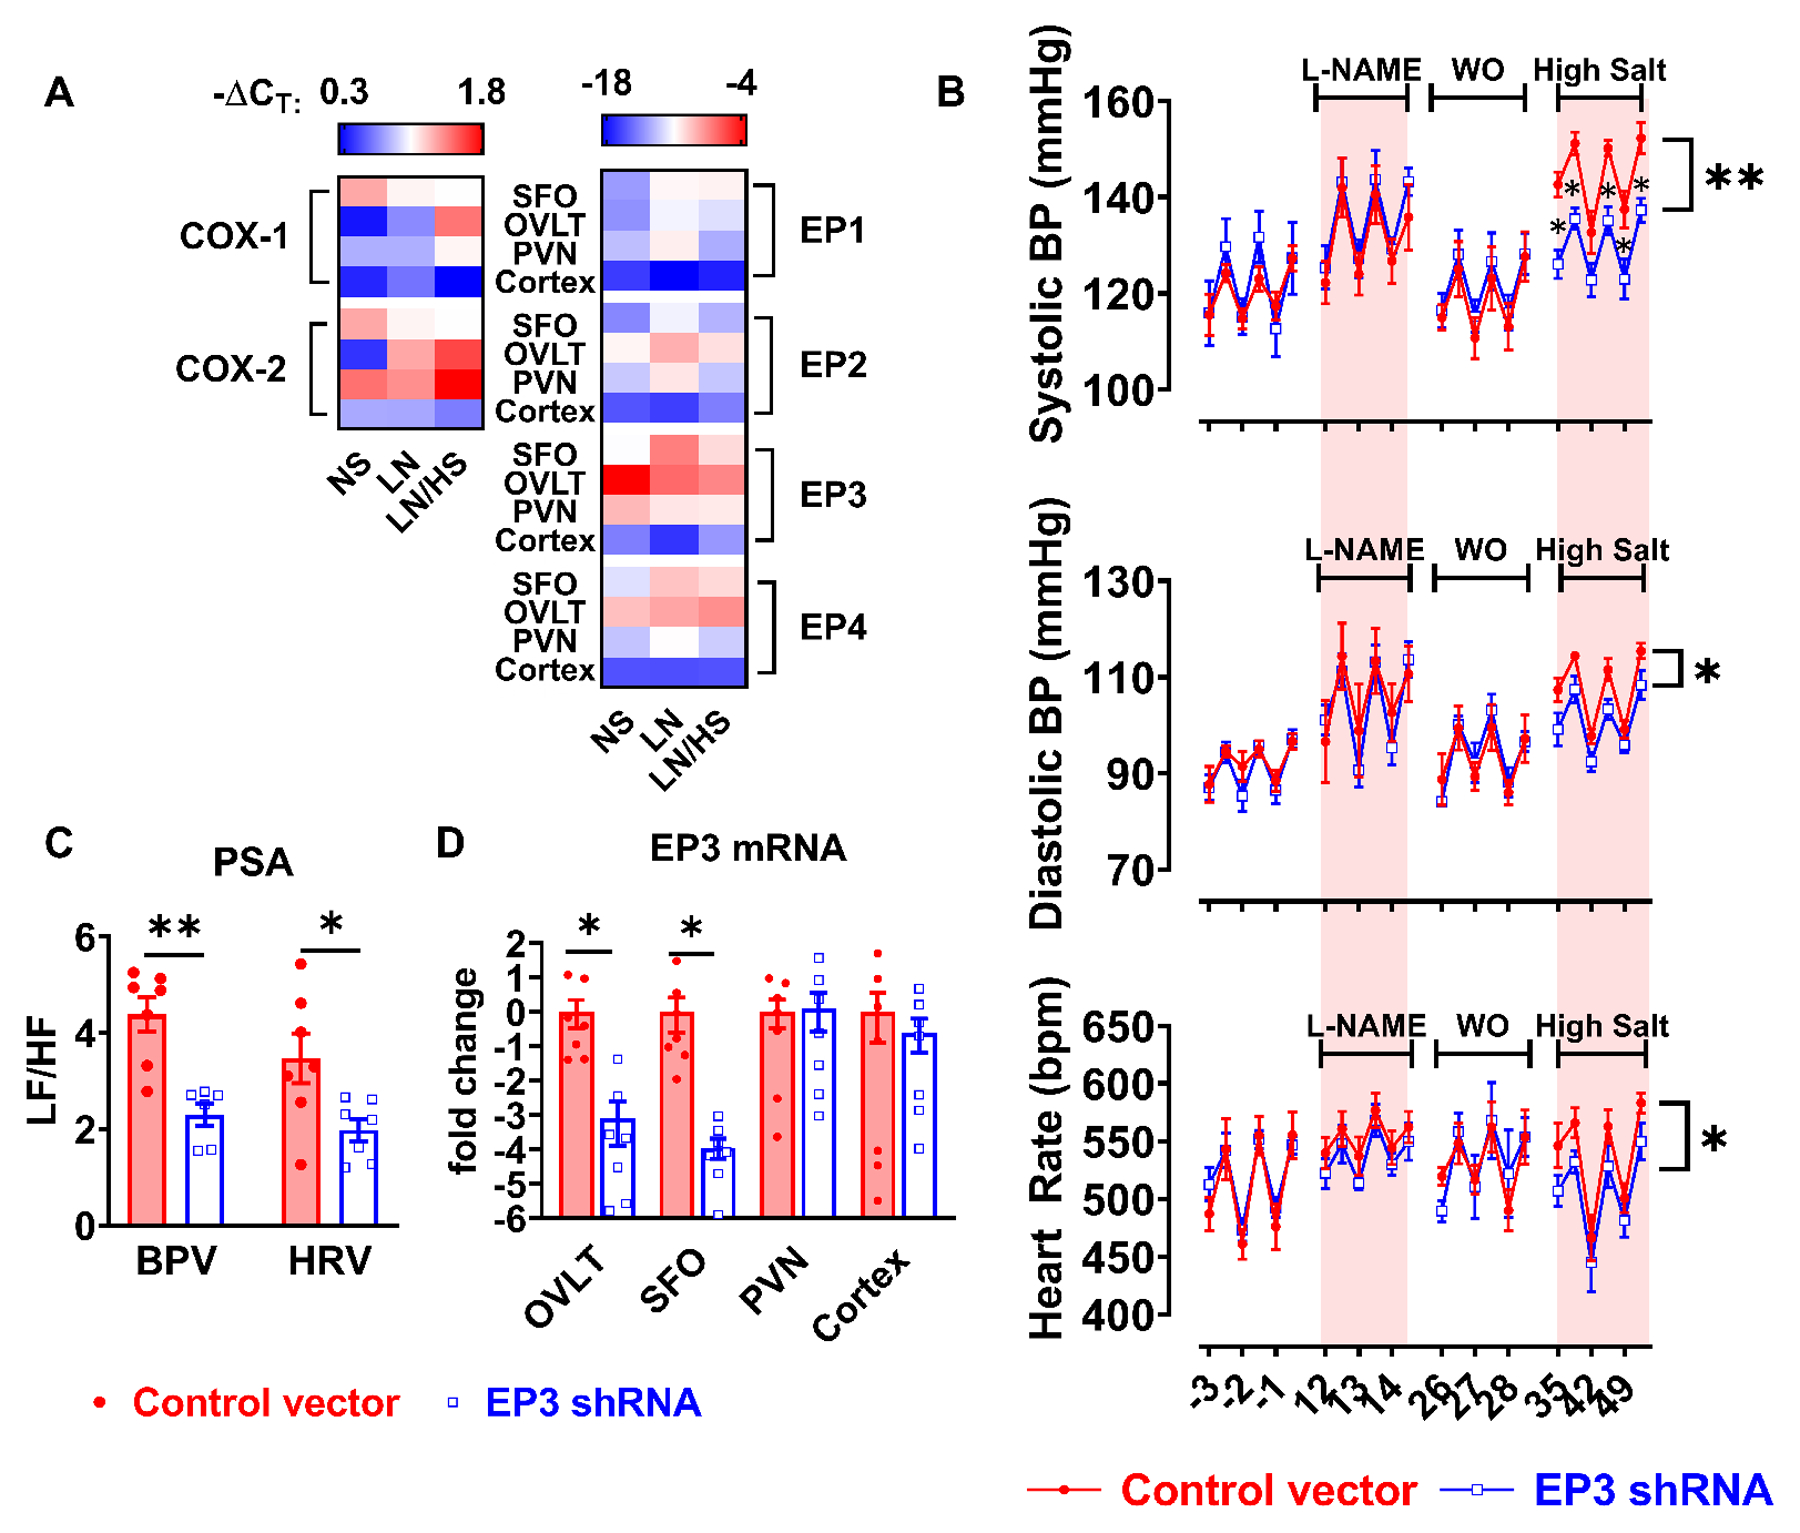
Figure 5:

Role of central EP3 receptors in L-NAME/high salt induced hypertension. Punch biopsies of the subfornical organ (SFO), organum vasculosum laminae terminalis (OVLT), paraventricular nucleus (PVN) and cortex were collected from mice after normal salt (NS), L-NAME only (LN), and L-NAME/high salt (LN/HS). Gene expression of COX-1, COX-2, and PGE2 receptors (EP1-EP4) was determined by real time PCR shown in (A). Beta-actin was used as control gene to calculate ΔCT, n=3 to 9 in each group. Knockdown EP3 receptor was accomplished by ICV injection of 107 lentivirus vectors encoding shRNAs targeting EP3 gene or scrambled control sequences. After recovery from surgery, mice were subjected to L-NAME/high salt protocol, and systolic blood pressure (BP), diastolic BP and heart rate were recorded using telemetry shown in (B). Data were analyzed by area under the curve followed with t test. Power spectra analyses (PSA) of blood pressure and heart rate variability (BPV and HRV) are shown in panel (C). After animals were sacrificed, EP3 receptor mRNA levels in OVLT, SFO, PVN, and cortex were determined by real time PCR shown in (D). Data were analyzed by multiple t tests, *P<0.05, **P<0.01, n=7 in both groups.
