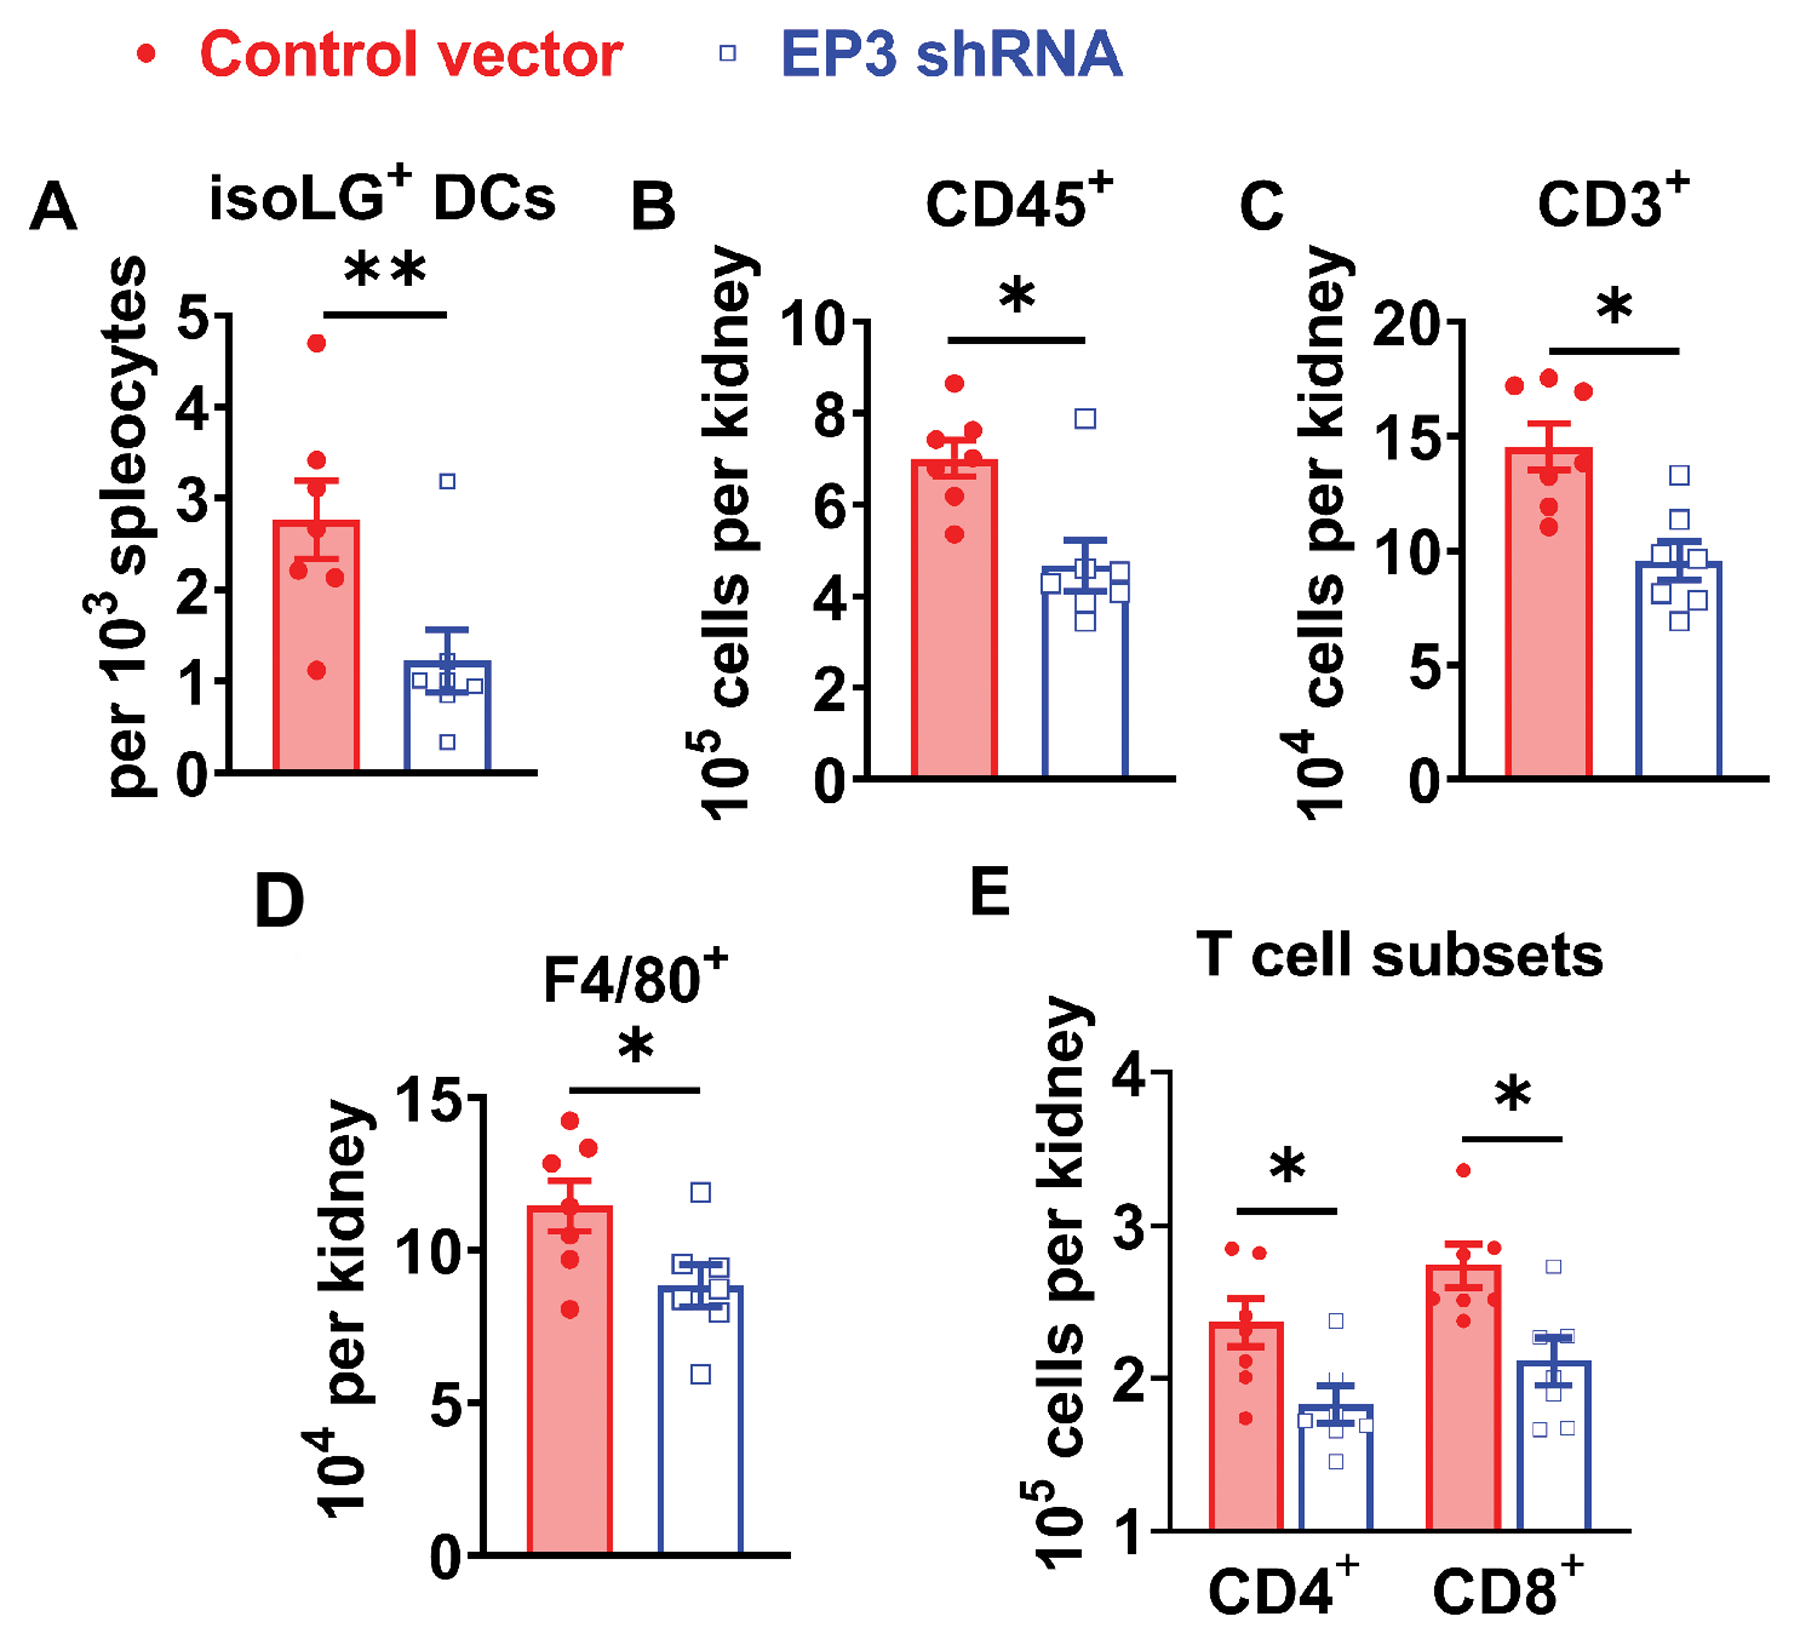
Figure 6:

Role of central EP3 receptors in L-NAME/high salt induced renal inflammation. IsoLG adducts in splenic DCs were quantified by flow cytometry shown in (A). Total leukocytes (CD45+), total T lymphocytes (CD3+), monocytes/macrophages (F4/80+), and CD4+ and CD8+ T cell subsets in the kidney were quantified by flow cytometry shown in from panel B to E. Data were analyzed by student t tests. P<0.05, **P<0.01, n=7 in both groups.
