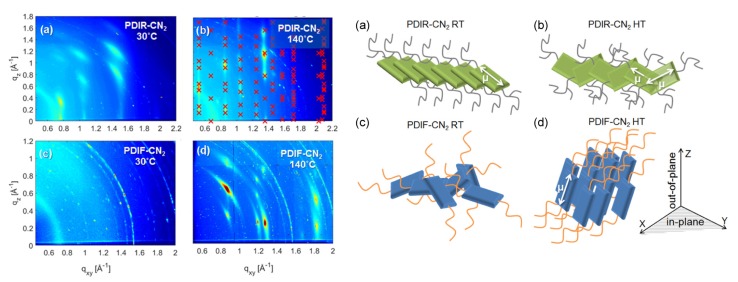
Figure 23.
Schematic representations of molecular arrangements in (a) PDIR-CN2 RT-phase, (b) PDIR-CN2 HT-phase, (c) amorphous PDIF-CN2, and (d) PDIF-CN2 thin film crystal phases together with corresponding GID measurements, where . Adapted from Belova et al. [219] with permission from the American Chemical Society under ACS Author Choice License.

