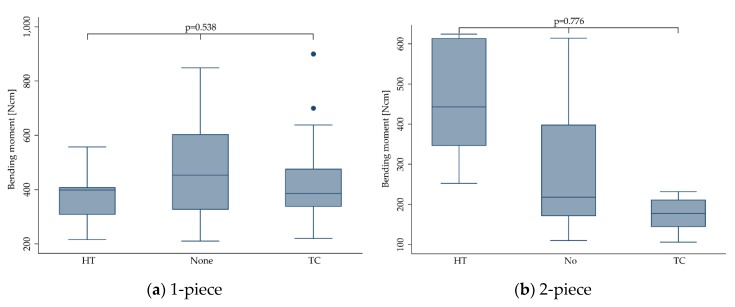
Figure 8.
Boxplots showing the bending moment at the time point of fracture, depending on the thermal aging conditions (none, HT = high temperature, TC = thermal cycling) for 1- (a) and 2-piece (b) zirconia implants. Whiskers are used to represent all samples lying within 1.5 times the interquartile range. Dots represent outliers. Detailed data can be found in Table 3 and Table 4.

