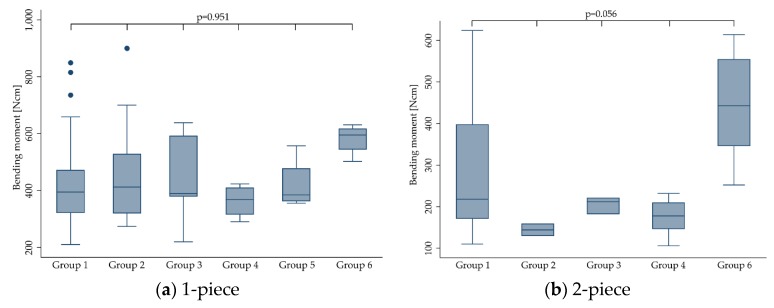
Figure 10.
Boxplots showing the bending moment at the time point of fracture depending on dynamic loading conditions respecting the applied load and amount of cycles (as categorized in Section 2.7) for 1- (a) and 2-piece (b) zirconia implants. Whiskers are used to represent all samples lying within 1.5 times the interquartile range. Dots represent outliers. Detailed data can be found in Table 3 and Table 4. No 2-piece implants were allocated to group 5.

