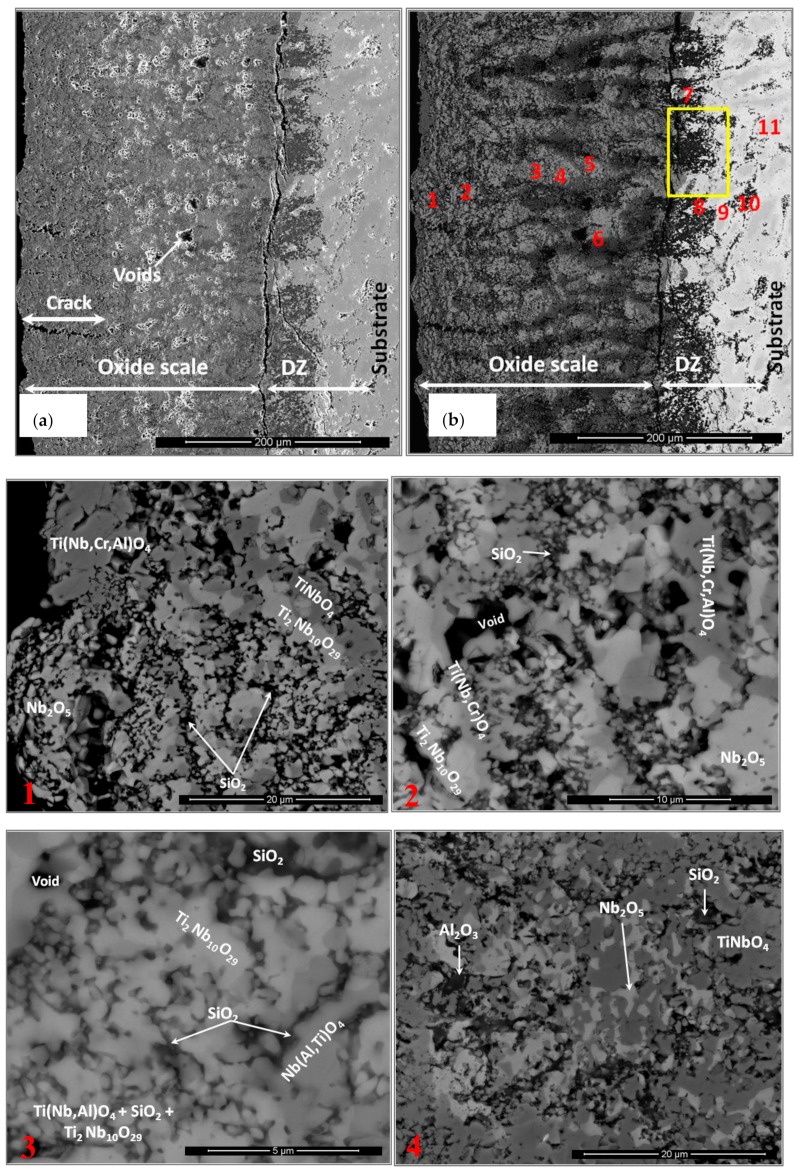
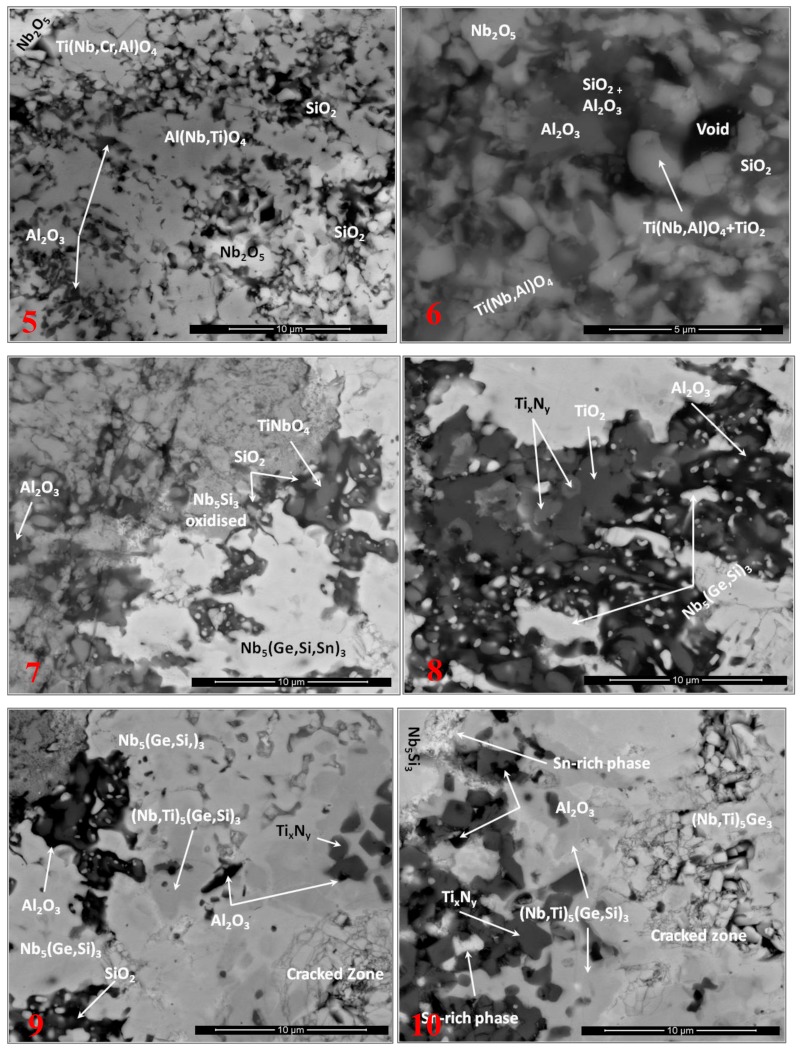
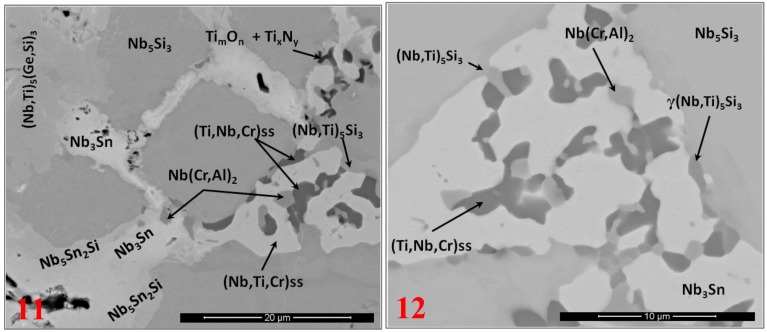
Figure 13.
Images of cross-sections of the alloy OHS1 after isothermal oxidation in air at 1200 °C: (a) SE, (b) BSE. The red numbers are related to the following BSE images: (c) #1 oxide scale (OS), (d) #2 OS, (e) #3 OS, (f) #4 OS, (g) #5 OS, (h) #6 OS, (i) #7 diffusion zone (DZ), (j) #8 DZ, (k) #9 DZ, (l) #10 DZ, (m) #11 DZ, and (n) #12 bulk of the alloy after oxidation. For yellow box in (b), see Figure 14.


