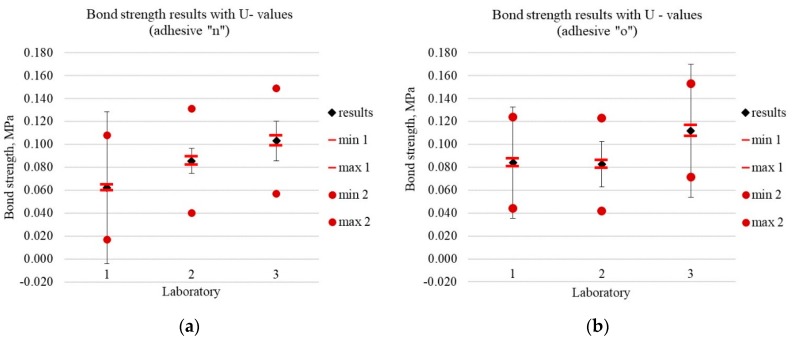
Figure 4.
Bond strength results with U value for three laboratories (1–3) and two materials (a) adhesive ‘n‘; (b) adhesive ‘o’. Black error bars are based on actual standard deviation (approach II). Points min 1 and max 1 are 95% coverage intervals obtained in approach I (only B-uncertainty of F and D values), points min 2 and max 2 are 95% coverage intervals obtained by the Monte Carlo method in approach IV, where reproducibility standard deviation obtained from inter-laboratory comparisons was used.

