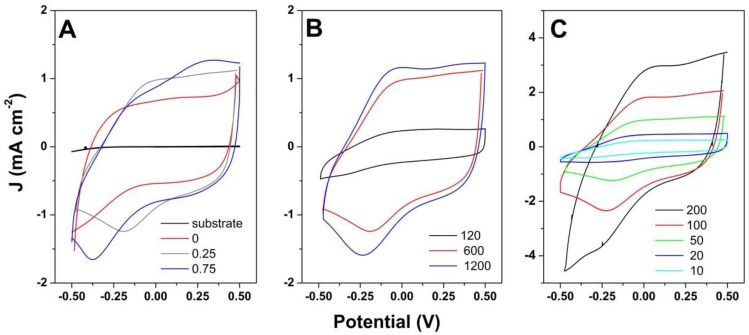
Figure 6.
CV curves at 50 mV·s−1 of (A) PPy/rGO obtained by galvanostatic mode for 600 s as a function of GO content (mg·L−1); (B) PPy hybridized with 0.25 mg·L−1 GO by galvanostatic mode at 1 mA cm−2 for varying duration (s); (C) CVs as a function of scan rate (mV·s−1) for PPy hybridized with 0.25 mg·L−1 GO at 1 mA·cm−2 for 600 s.

