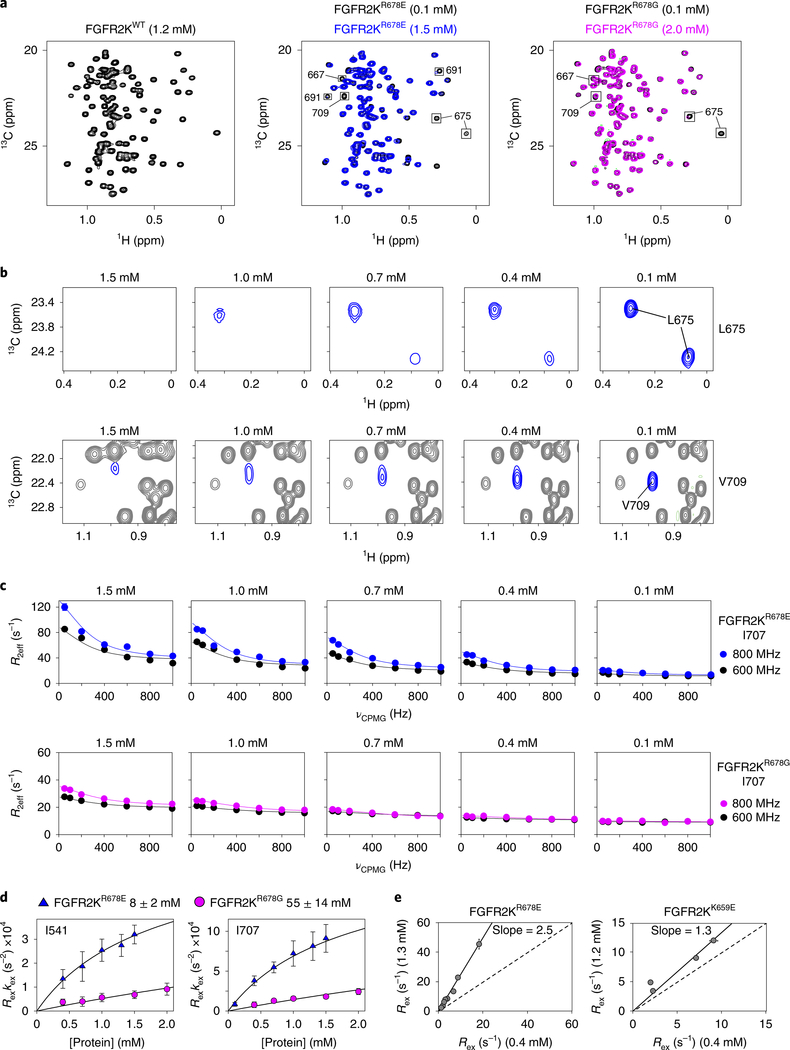
Fig. 3 |. The crystallographically deduced A-loop-transphosphorylation asymmetric complex forms in solution.
a, Overlays of leucine/valine regions of 1H/13C methyl HMQC spectra for FGFR2KR678E (middle) and FGFR2KR678G (right) mutants acquired at either high (1.5 mM for R678E; 2.0 mM for FGFR2KR678G) or low (0.1 mM) concentrations. Peaks sustaining >20% intensity loss are boxed. Left, corresponding spectrum of FGFR2KWT at 1.2 mM is shown for comparison. HMQC experiments were performed independently twice with similar results. b, Dilution-dependent reappearance of peaks corresponding to L675 (top) and V709 (bottom) for FGFR2KR678E. c, CPMG dispersion curves for I707 in FGFR2KR678E (top) and FGFR2KR678G (bottom) at the protein concentrations shown. Curves plotted in blue and black represent data collected at 800 MHz and 600 MHz, respectively. Note that the 0.1 mM FGFR2KR678E dataset in blue was collected at 900 MHz. d, Plots of kex × Rex derived from CPMG relaxation dispersion experiments for FGFR2KR678E and FGFR2KR678G as a function of protein concentration. Plots were globally fitted using multiple residues to estimate dimerization Kd values (boxed above). Error bars for kex × Rex and Kd values reflect errors from non-linear least squares fits. e, Correlation plots of Rex values for FGFR2KR678E (left) and FGFR2KK659E (right) determined at 1.3 mM and 0.4 mM (FGFR2KR678E) and 1.2 mM and 0.4 mM (FGFR2KK659E), respectively. A slope of 1.0 is indicated by the dashed line. For d and e, n = 1 using independent samples; two technical replicates were acquired for select CPMG frequencies. The center value is the optimal fit to the data using equation (2). For e, the solid line is a linear correlation with the best fit slope to the data reported and a y-intercept of 0.

