
. 2020 Jan 27;9(3):194–200. doi: 10.1530/EC-19-0534
 This work is licensed under a
 Figure 1.
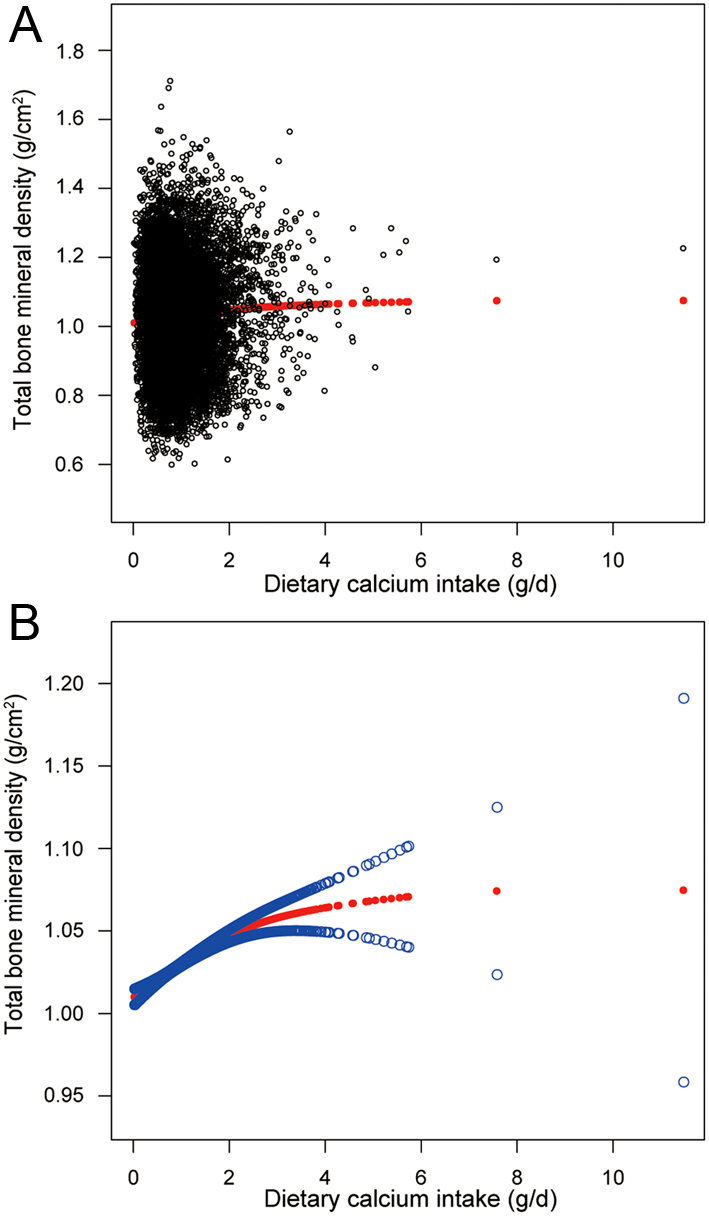
The illustrated curved line relation between dietary Ca intake and total bone mineral density. (A) Each black point represents a sample. (B) The area between two blue dotted lines is expressed as a 95% CI. Each point shows the magnitude of the dietary Ca intake and is connected to form a continuous line.