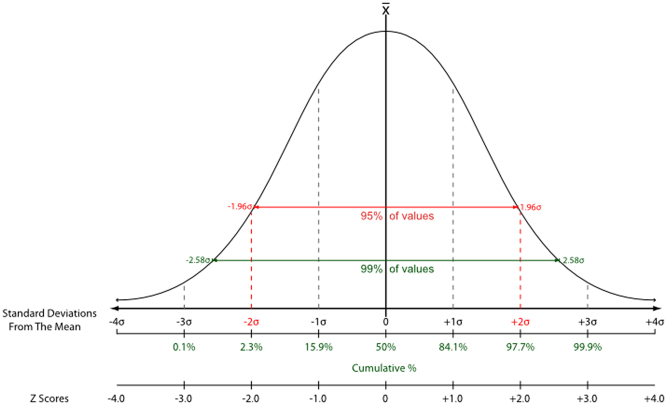
Figure 1.
The normal distribution curve. Using a combination of the population mean and standard deviation, reference limits can be calculated. A range of values encompassing 2 standard deviations above and below the population mean includes 96.4% of all ‘normal’ subjects. Similarly, 3 standard deviations encompass 99.7% of the normal population.

 This work is licensed under a