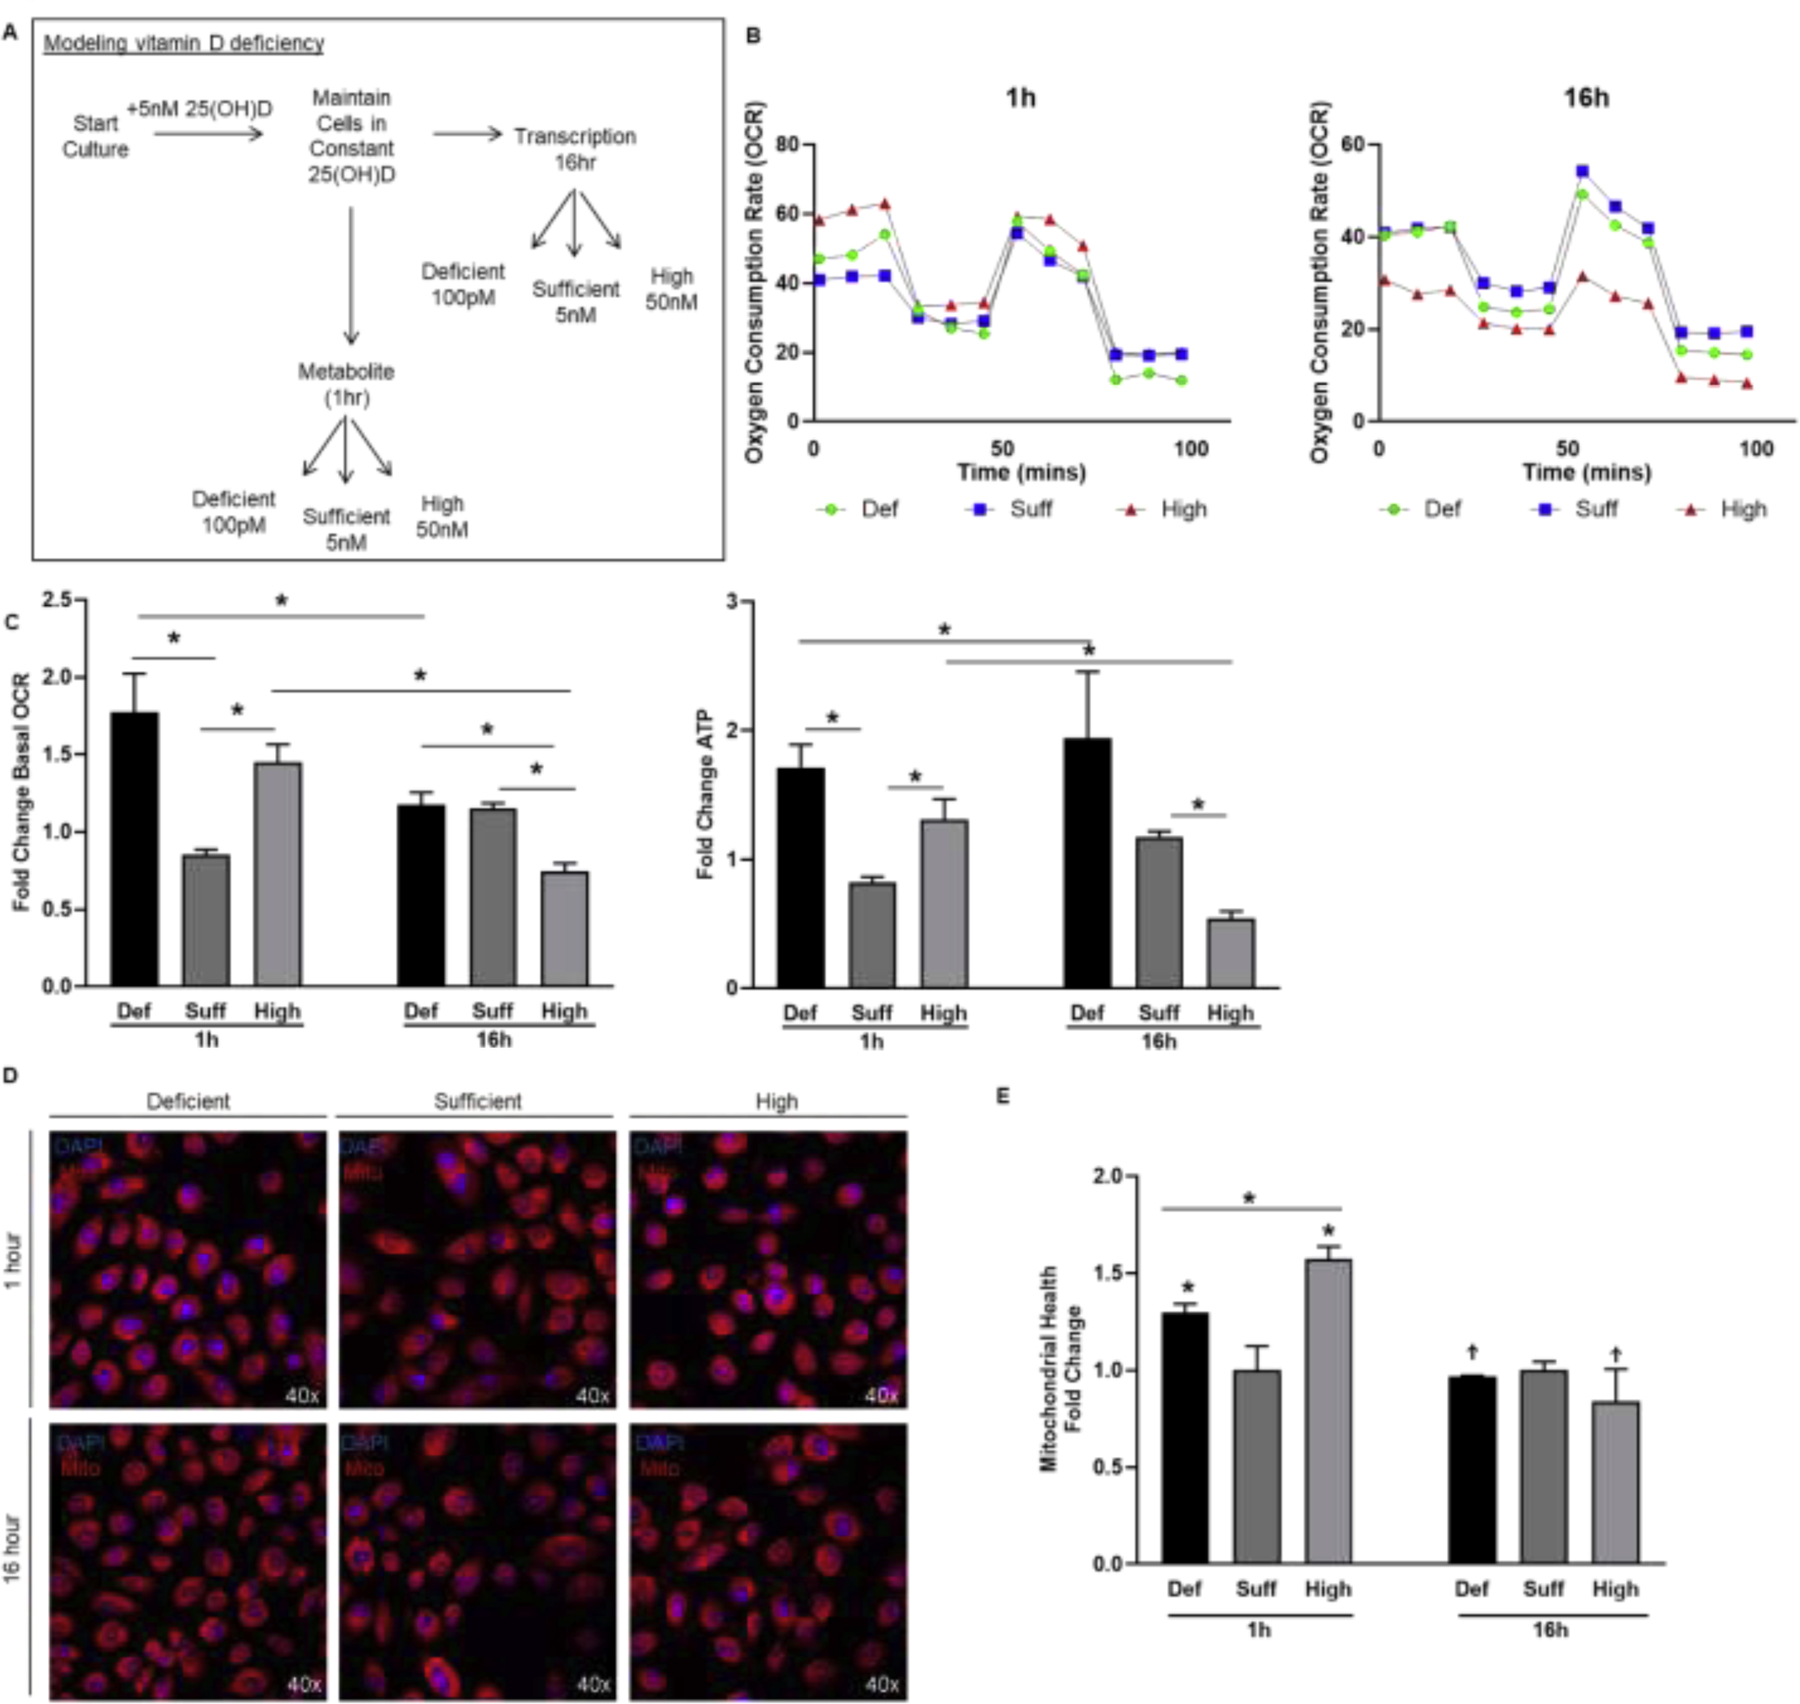
Figure 4. Modeling vitamin D deficiency in vitro shows alteration of 25(OH)D increased mitochondrial stress at 1 hour.

A, Diagram of physiologically-relevant cell culture model to examine mitochondrial responses to alteration in 25(OH)D status. B-C, Seahorse XFe24 output of OCR over time in 957E/hTERT cells maintained in 25(OH)D and switched to a deficient dose of 100pM (green), maintained at sufficient dose of 5nM (blue), or changed to a high dose of 50nM (red) for 1 hour (left panel) and 16 hours (right panel). Bar graphs show mean (±SEM) change in basal respiration and ATP production relative to sufficient 25(OH)D. D-E, Representative images and quantification of fluorescence from the mitohealth assay on 957E/hTERT cells treated with deficient, sufficient, or high dose of 25(OH)D for 1 hour and 16 hours and mitochondrial membrane potential (red) was quantified. Graphs show mean of N=3 biological replicates (3 technical replicates within each experiment) with standard error. Student’s t-test: P<.05=* P<.005= ** P<.0005= ***.
