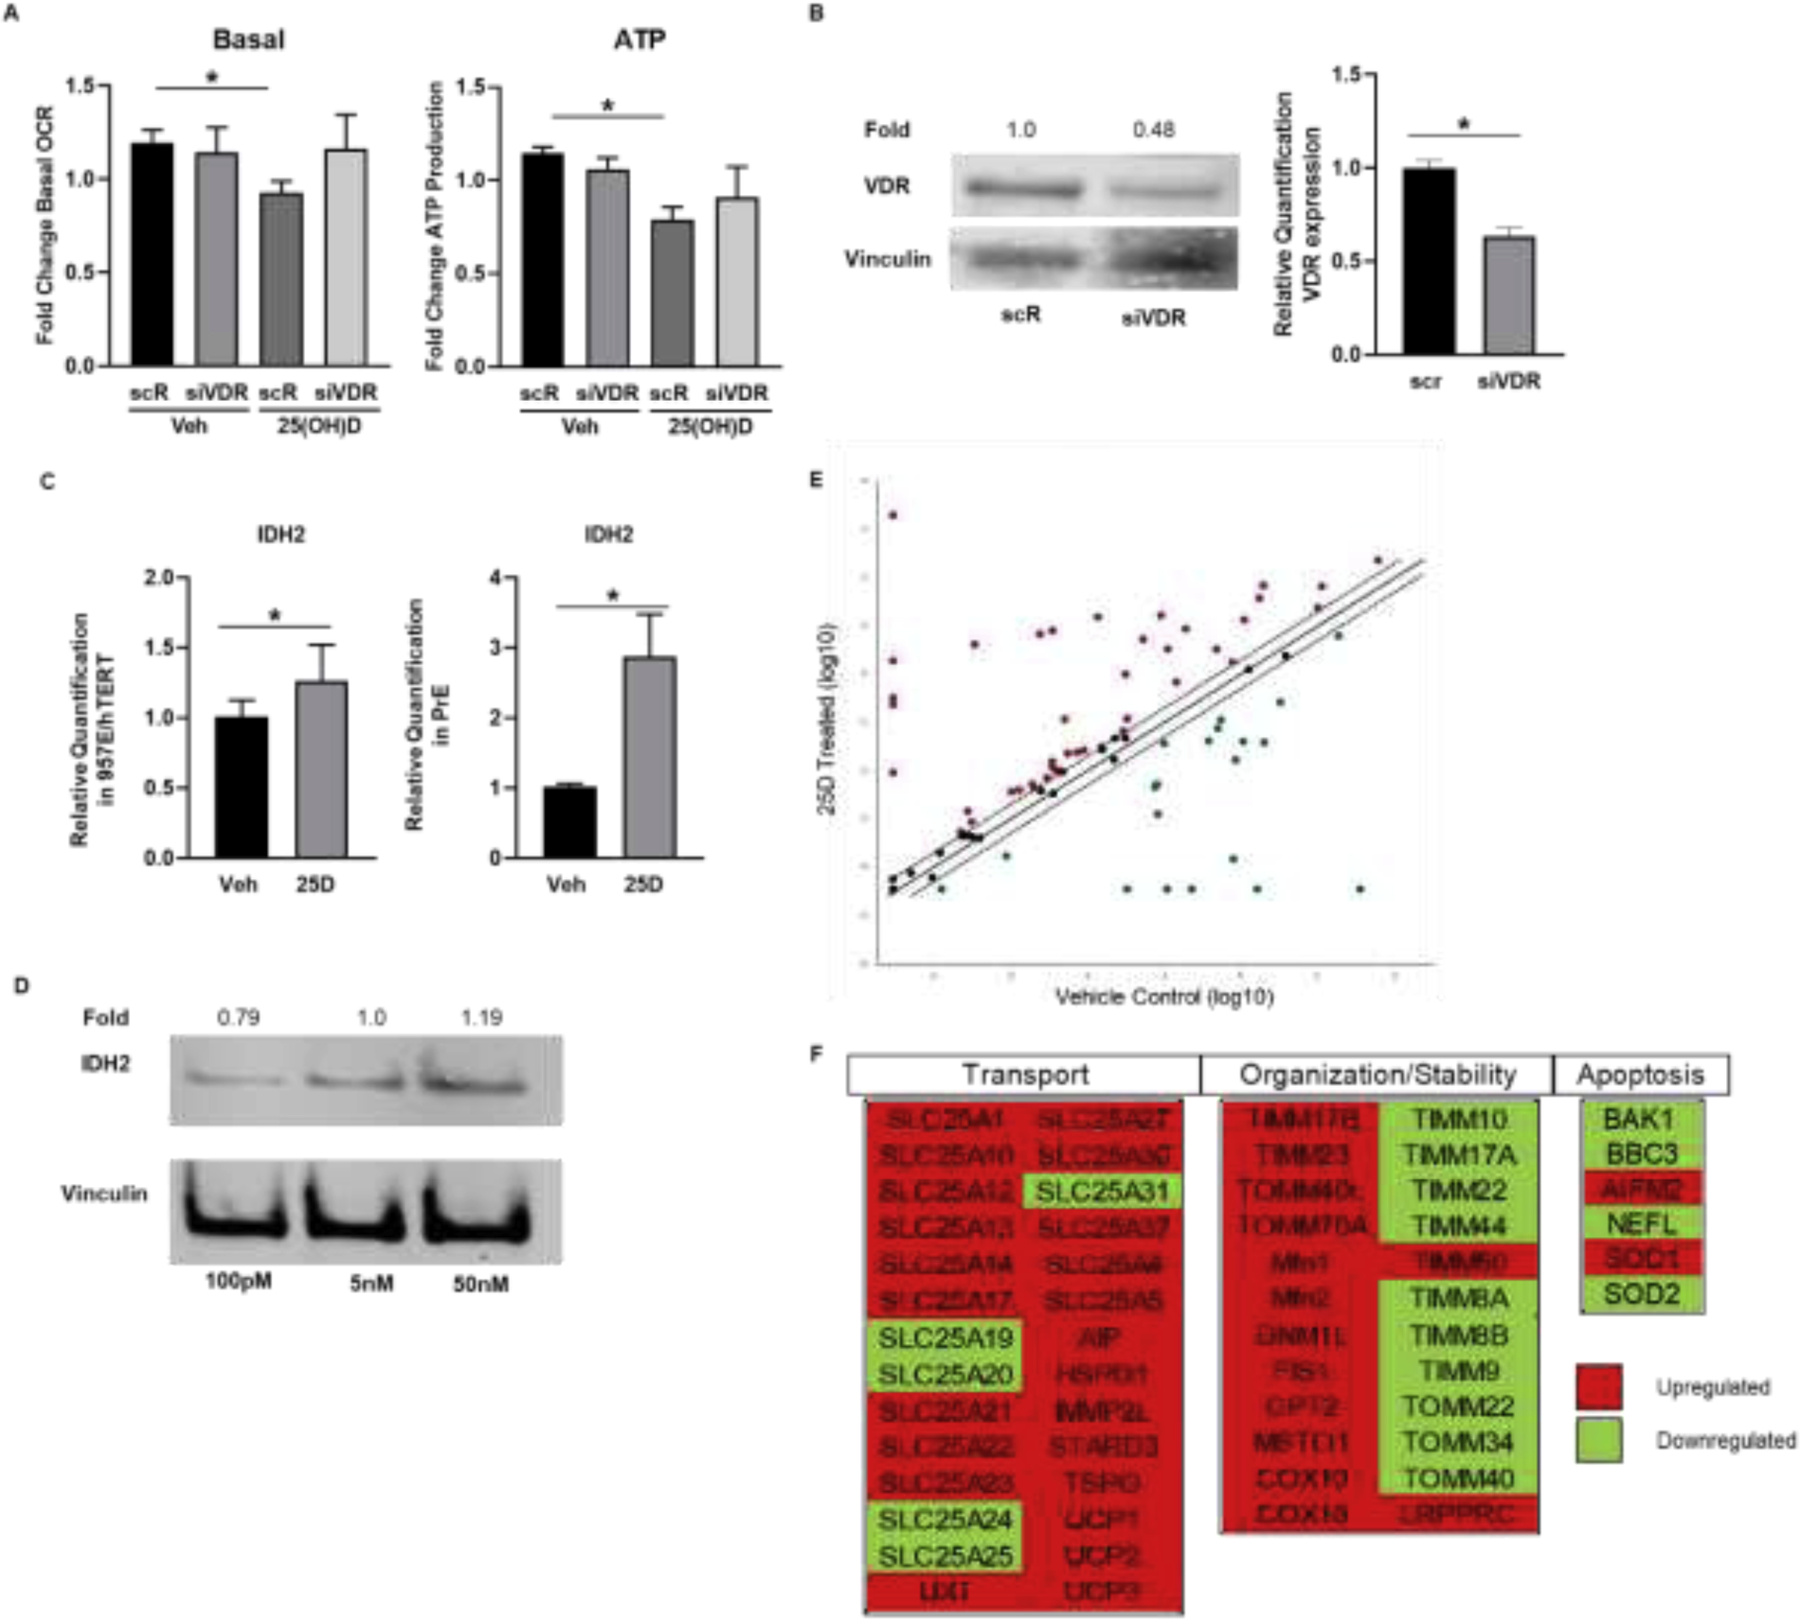
Figure 5. Transcriptional regulation of metabolism and mitochondrial function by 25(OH)D.

A, Seahorse XFE24 output of OCR over time from 957E/hTERT cells with a knockdown of VDR. Bar graphs show mean (± SEM) change in basal respiration and ATP production. B, Transfection of 957E/hTERT cells with siRNA for VDR induced a 50% knockdown in VDR protein and RNA levels. Gene expression by RT-qPCR of metabolic regulatory gene, IDH2, in 957E/hTERT cells and PrE cells (C) treated with 50nM 25(OH)D for 16 hours. Graphs show mean relative quantification (RQ) shown normalized to HPRT of N=3 biological replicates (3 technical replicates within each experiment) with standard error. Student’s t-test: P<.05= * P<.00%= ** P<.0005= ***. D, Protein expression of IDH2 after 5nM 25(OH)D constant culture and treatment changed to 100pM, 5nM, or 50nM for 16 hours. Fold change relative to 5nM. E and F, Results from mitochondrial gene RT-qPCR panel from PrE cells treated with 50nM 25(OH)D for 16 hours. Data shown by scatter plot and gene table of mitochondrial dynamic, transport, and apoptotic genes. Gene table denotes upregulation (red) and downregulation (green) of 25(OH)D treated cells relative to vehicle control cells. Scatterplot denotes significant change at +/−2-fold change.
