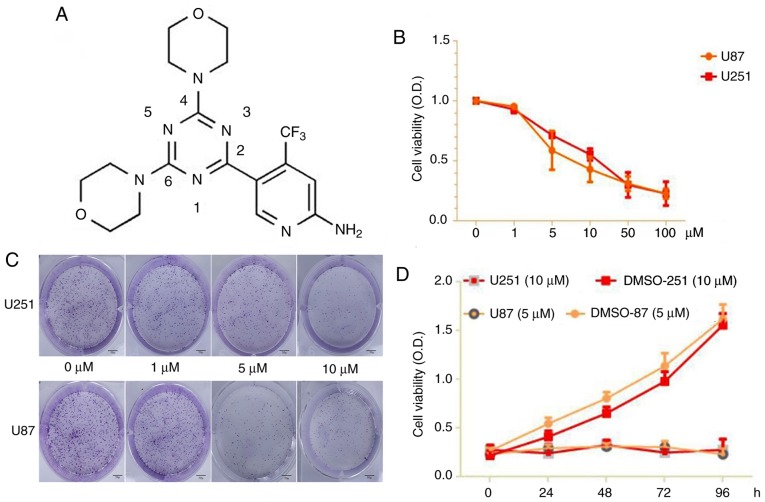
Figure 1.
(A) Molecular structure of PQR309. (B) Cell viability for U87 and U251 cells after being treated with PQR309 with various concentrations. (C) The colony formation rates of U87 and U251 cells in various concentration groups. Scale bar, 50 µm. (D) Each cell line was treated at different time-points with the IC50 values of PQR309 for the CCK-8 assay. Each cell line was analyzed in triplicate.

