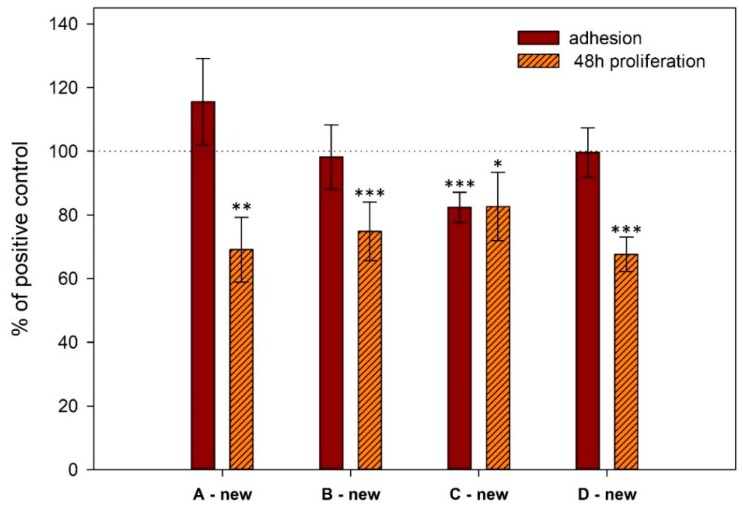
Figure 3.
Comparison of cell adhesion and proliferation on the surface of new titanium samples assessed by CCK-8 assay in four independent experiments. The standard errors were calculated from five replicates. Data expressed as a percentage of positive control. Error bars indicate means ± standard deviations. Asterisks above the bars indicate significant differences (* p < 0.05, ** p < 0.01, *** p < 0.001) between titanium samples and positive controls.

