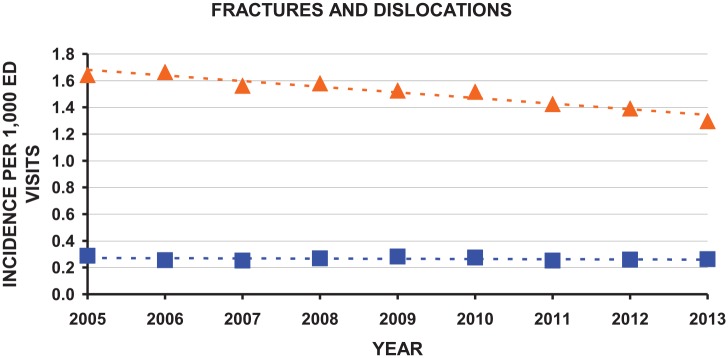
Figure 2.
Annual fracture and dislocation emergency department (ED) visit incidence over time. There was a slight decrease in incidence over time for fractures (orange). The estimated incidence values are shown as solid orange triangles, and the best fit by the hatched orange line. This best fit line is represented by the equation: incidence = −86.31 – 0.042(year) (r2 = 0.93; P = 0.000034). There was no change in incidence of dislocations (blue) over time. The estimated incidence values are shown as solid blue squares, and the best fit by the hatched blue line. This fit was not significant (r2 = 0.079; P = 0.47).

