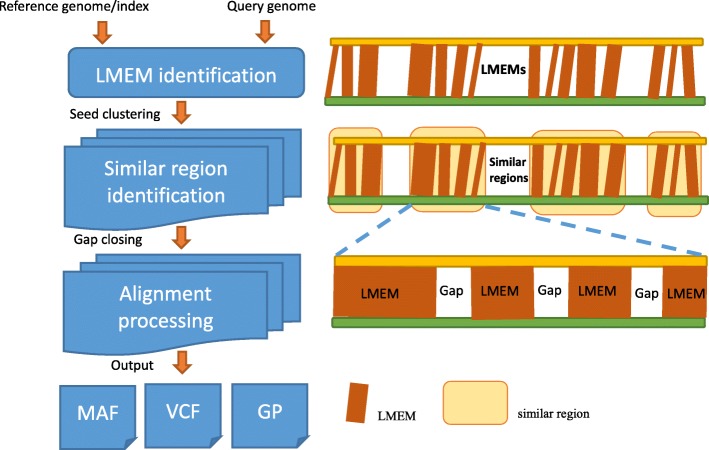
Fig. 1.
The flowchart of GSAlign. Each rectangle is an LMEM (simple pair) and the width is the size of the LMEM. They are then clustered into similar regions, each of which consists of adjacent LMEMs and gaps in between. We then perform gapped/un-gapped alignment to close those gaps to build the complete alignment for each similar region

