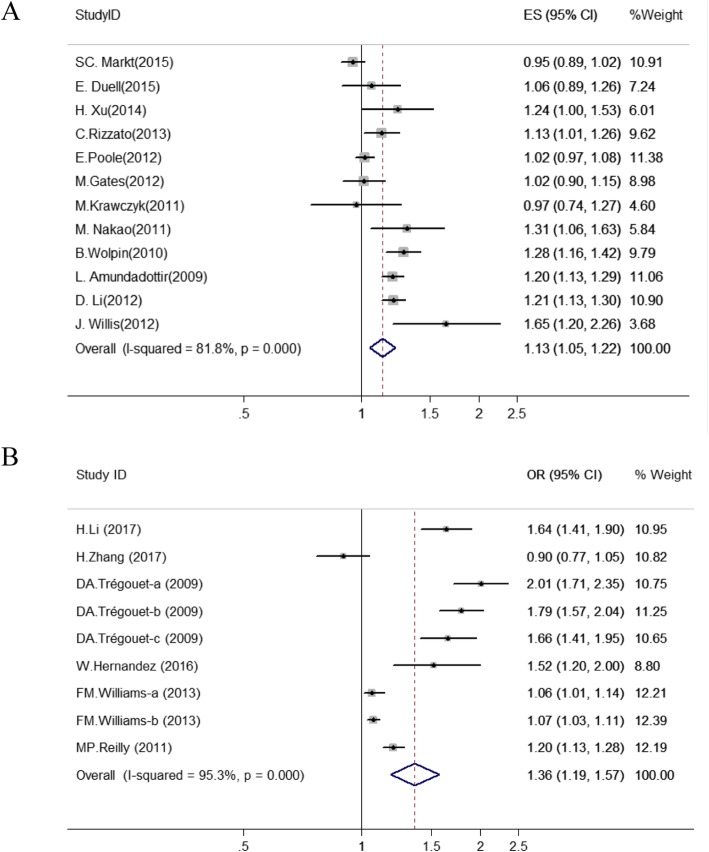
Fig. 2.
Forest plot of the relationship between rs505922 polymorphisms and cancer (a) and cardiocerebrovascular disease (b) risk (allele model and random-effect model). The circle and horizontal lines correspond to OR and 95% CI and the area of the squares reflects the weight of individual studies included in the meta-analysis. The diamond represents the pooled ORs and 95% CI. The dotted red line represents the total OR value

