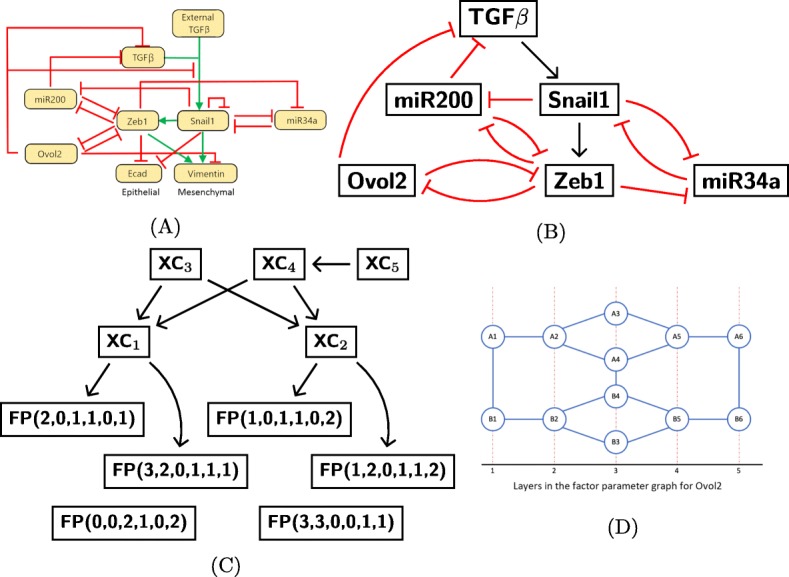
Fig. 2.

Parameter graph representation of the parameter space. a The EMT network from [11]. b The EMT network that we use for the analysis in this manuscript. c An example of the many possible Morse graphs for the network in (b). d The factor parameter graph for Ovol2. Each node represents one way in which the inputs of Ovol2 are integrated and affect the downstream nodes of Ovol2. Each node is characterized by the corresponding inequalities given in (1). Nodes colored in red are associated to essential parameters
