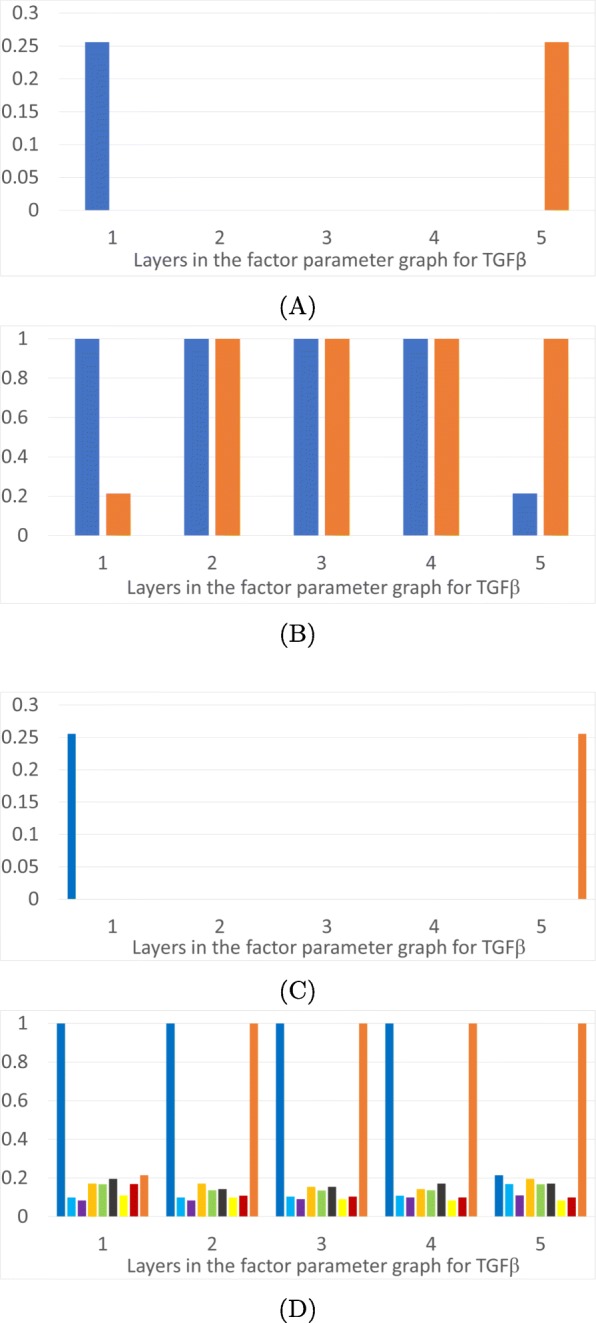
Fig. 3.

Epithelial and mesenchymal states as a function of level of TGF β. The horizontal axis is the five layers in the factor parameter graph for TGF β, which is isomorphic to half of the factor parameter graph for Ovol2 in Fig. 2d. a: Proportions of parameter nodes with monostable E (dark blue) or M (orange) states. b: Proportions of parameter nodes with the occurrence of E or M in each layer of the TGF β factor parameter graph. c: Proportions of parameter nodes with monostable FP in color coded layers of the 3D projection of the phase space in Fig. 1d. d: Proportions of parameter nodes that exhibit an FP, not necessarily monostable, in color coded layers of the 3D projection of the phase space in Fig. 1d
