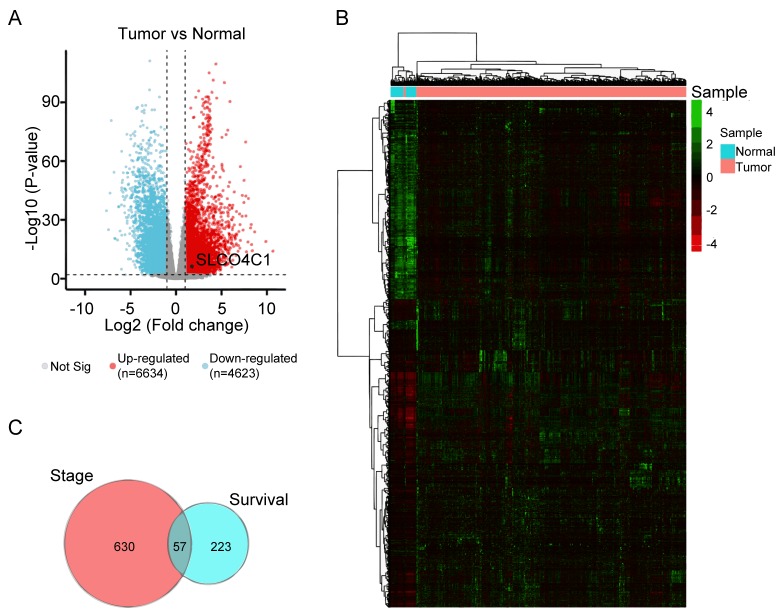
Figure 1.
DEG expression in EC based on TCGA datasets. (A) Volcano plot showing the gene expression differences between normal and EC patient cohorts. Blue dots, downregulated genes. Red dots, upregulated genes. Black dot, SLCO4C1. (B) Heatmap of the expression of 6,634 upregulated and 4,623 downregulated genes, when comparing normal to EC tissues from TCGA database. (C) Venn analysis of 57 overlapping genes associated with clinical stage and survival time. DEG, differentially expressed genes; EC, endometrial cancer; TCGA, The Cancer Genome Atlas; SLCO4C1, solute carrier organic anion transporter family member 4C1.

