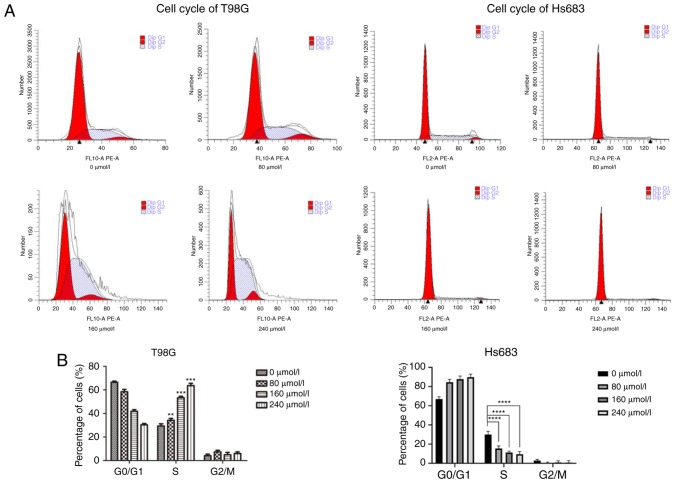
Figure 4.
Cell cycle of CVB-D-treated glioma cells. (A) Cell cycle analysis of CVB-D treated T98G and Hs683 cells as detected by flow cytometry (0, 80, 160 and 240 µmol/l). (B) Statistical analysis of the percentage of cells at the G0/G1, S and G2/M phases of the T98G and Hs683 cell cycle. Each group was compared with the 0 µmol/l group with regard to the S phase. **P<0.01, ***P<0.001, ****P<0.0001. CVB-D, Cyclovirobuxine D.

