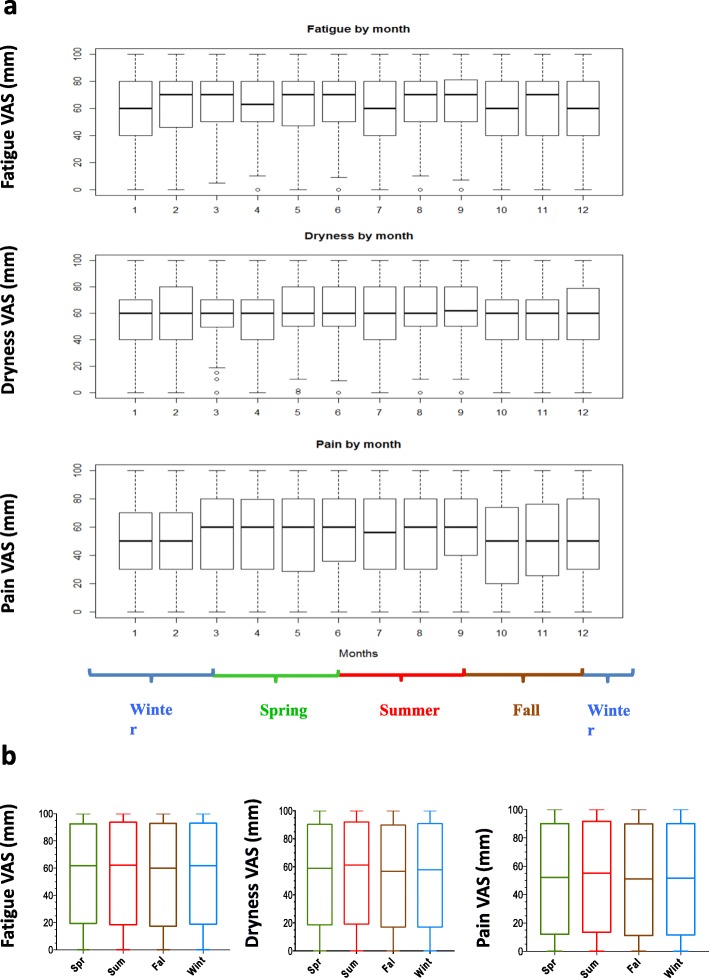
Fig. 2.
Pain, fatigue and dryness fluctuations across months and seasons. a Box plots of VAS variations between months from January (month: 1) to December (month: 12). b Box plots of VAS variations between seasons. Spring (Spr) is depicted in green, summer (Sum) in red, fall (Fal) in brown and winter (Wint) in blue

