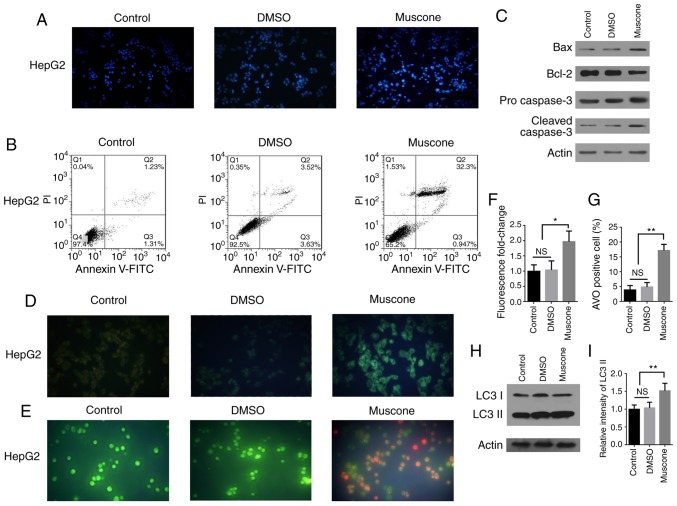
Figure 2.
Muscone induces apoptosis and autophagy in HepG2 cells. (A) HepG2 cells were treated with DMSO or muscone for 24 h, and then stained with DAPI and examined by fluorescence microscopy at an ×40 magnification (Olympus IX71). Blue staining represents the cell nucleus and the control represents cells that did not receive treatment. (B) HepG2 cells were treated with DMSO or muscone for 24 h and subsequently double stained with Annexin V-FITC/PI. Apoptosis was analyzed using flow cytometry. (C) HepG2 cells were treated with DMSO or muscone for 24 h and the protein expression levels of Bax, Bcl-2, pro-caspase-3 and cleaved caspase-3 were analyzed using western blotting. (D and E) Representative micrographs (×100 magnification, Olympus IX71) of (D) MDC and (E) AO staining following treatment of HepG2 cells with DMSO or muscone for 24 h. (F) MDC fluorescence intensity fold-change was semi-quantified using a fluorescence microplate reader. (G) Positive AO staining and cell counting. (H) HepG2 cells were treated with DMSO or muscone for 24 h and LC3 I and LC3 II expression levels were analyzed using western blotting. (I) LC3 II levels were quantified by densitometric analysis relative to LC3 I. Error bars represent the standard deviations for n=3. *P<0.05, **P<0.01; n=3; NS, not significant; PI, propidium iodide; MDC, monodansylcadaverine; AO, acridine orange; LC3, light chain 3.

