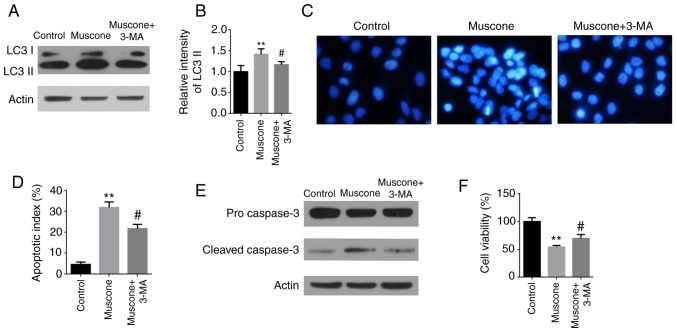
Figure 5.
Effect of autophagy on muscone-induced apoptosis in HepG2 cells. HepG2 cells were pretreated with or without 1 mM 3-MA for 2 h, and then treated with muscone for 24 h. (A) LC3 I and LC3 II expression levels were measured using western blotting. (B) LC3 II levels were quantified by densitometric analysis relative to LC3 I. Error bars represent the standard deviations for n=3. (C) Apoptotic nuclear changes were assessed using Hoechst staining at an ×200 magnification (Olympus IX71). (D) Apoptotic index was determined using the micrographs obtained in part B. (E) Protein expression levels of pro-caspase-3 and cleaved caspase-3 in HepG2 cells were analyzed using western blotting. (F) Cell viability of HepG2 cells was measured using a Cell Counting Kit-8 assay. **P<0.01 vs. control group; #P<0.05 vs. muscone group; n=3. LC3, light chain 3; 3-MA, 3-methyladenine.

