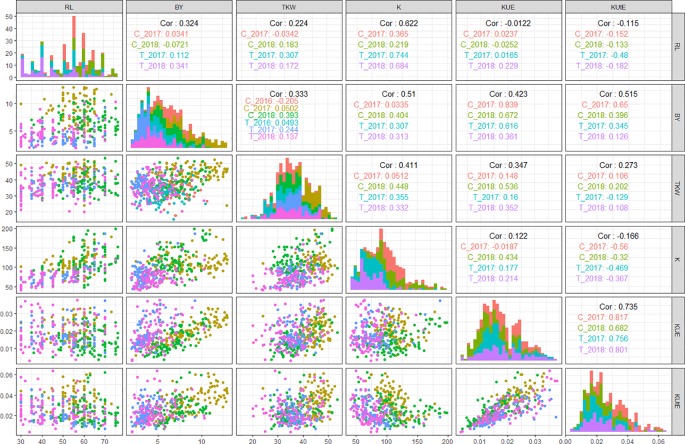
Figure 3.
QQ scatterplots, histograms, and coefficient of correlation between K-use efficiency (KUE) traits from field experiments. The plots in center cutting the figure into upper and lower triangles represent histograms. Lower triangle represents QQ scatter plots and upper triangle represents coefficient of correlations (r 2 values) in different treatments in all field environments; x and y axes of histograms and scatter plots represent phenotypic distribution of traits. *cf. Trait nomenclature is presented in Table 2 legends.

