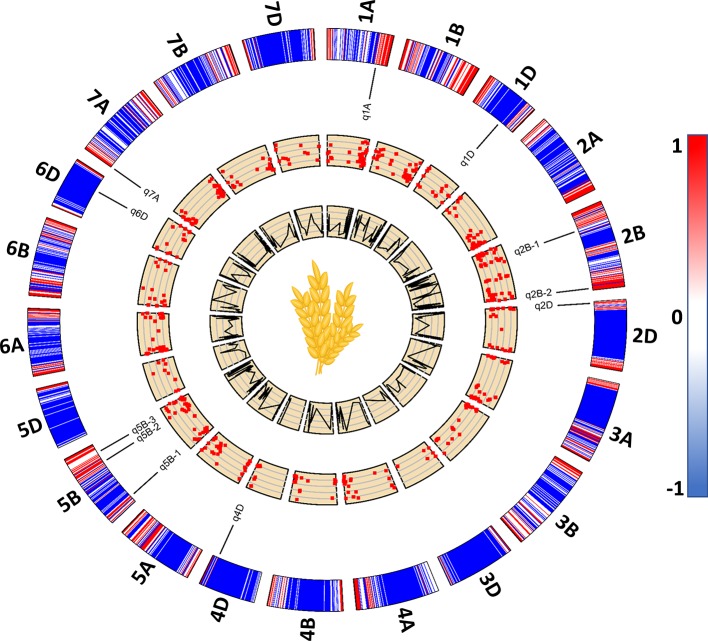
Figure 5.
A 2D track plot visualizing genomic data. The outermost track represents heatmap of marker density in the genotype data used for genome-wide association studies (GWAS) and the placement of stable loci on wheat chromosomes with respect to their physical position. Scatterplots represent significant marker-trait associations (MTA) with lower to higher -log10p from inside out. The innermost line plots represent the LOD score threshold of significant MTA.

