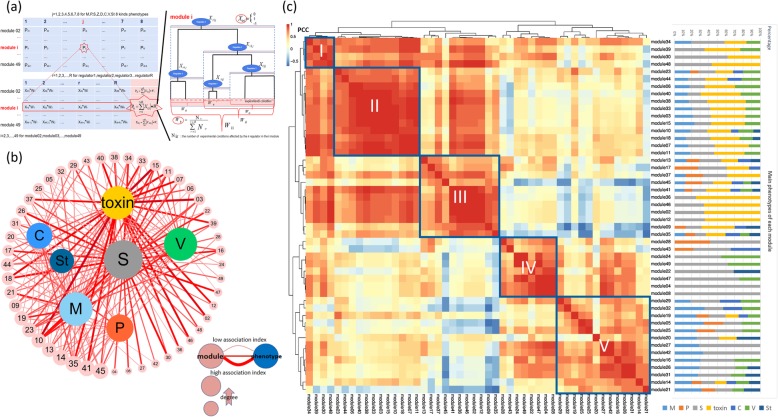
Fig. 4.
Computational analysis of module-phenotype associations. a. Schematic demonstration of the computational method used to mine the module-phenotype association. The computational method calculates the association index based on the regulator’s phenotype, the regulator’s hierarchical position on the regulation tree, and the proportion of activated conditions in all experiments. b. Module-phenotype association network based on the association index. The outer circle nodes represent modules, and the inner nodes represent phenotypes: M (mycelial growth), C (conidation), P (pigmentation), V (virulence), Toxin (DON and ZEA production), S (sexual reproduction) and St (stress response). The edges denote the associations between modules and phenotypes; the line sizes are proportional to AI of the association. c. Correlation analysis of all predicted modules using Pearson correlation coefficients (PCC) based on the calculated association index. The modules are clustered using hierarchical clustering, and a heatmap of the PCCs (the scale bar denotes the PCC range) is then produced. The stacked bar graph adjacent to the heatmap summarizes the phenotype association within each module based on the association index

