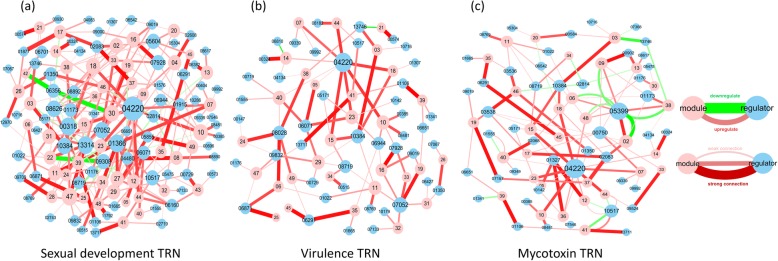
Fig. 5.
Fusarium graminearum subnetworks involved in the regulation of key phenotypes: sexual reproduction (a), virulence (b), mycotoxin production (c). In each network, the edges represent the connections between the two nodes, which in turn represent the contributions of different regulators to the module. The red line represents a positive effect of the regulator on the corresponding phenotype, the green line represents a negative effect, and the thickness and color depth of the connection indicates the strength of the effect

