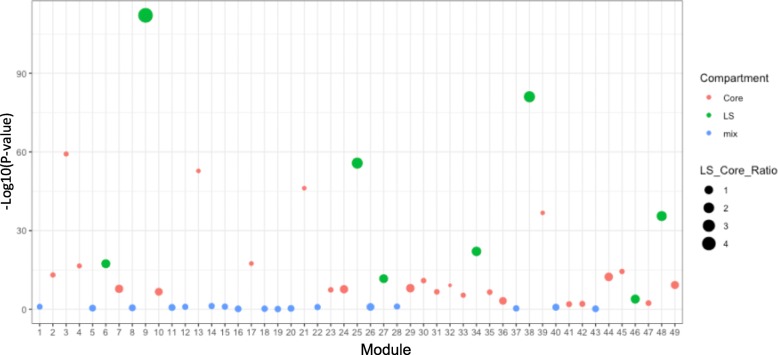
Fig. 6.
Compartmentalization of module networks into core and lineage-specific genome regions of Fusarium graminearum. Each of 49 F. graminearum modules was tested for enrichment of LS and core genes using two-tailed Fisher’s exact test. The dot plot summarizes the enrichment results; the X axis shows the module, the Y axis shows the test P-value for each module (−log10 transformed), and the solid horizontal line represents the threshold (P-value < 0.05). The color of the dot denotes the enriched compartment (green: LS; red: core; blue: not enriched) for each module. The size of the dot is proportional to the ratio of LS to core genes in each module

