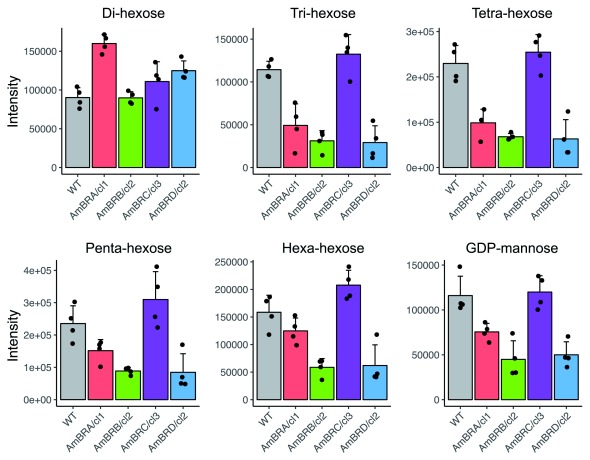
Figure 3. Metabolite intensity plots for metabolites relating to mannogen synthesis.
Metabolites were identified as di- to hexa-hexoses on the basis of mass, and may be oligomannans, as described in the text. Mean intensities across four biological replicates are shown, with error bars representing standard deviation. Black points represent intensities of individual replicates.

