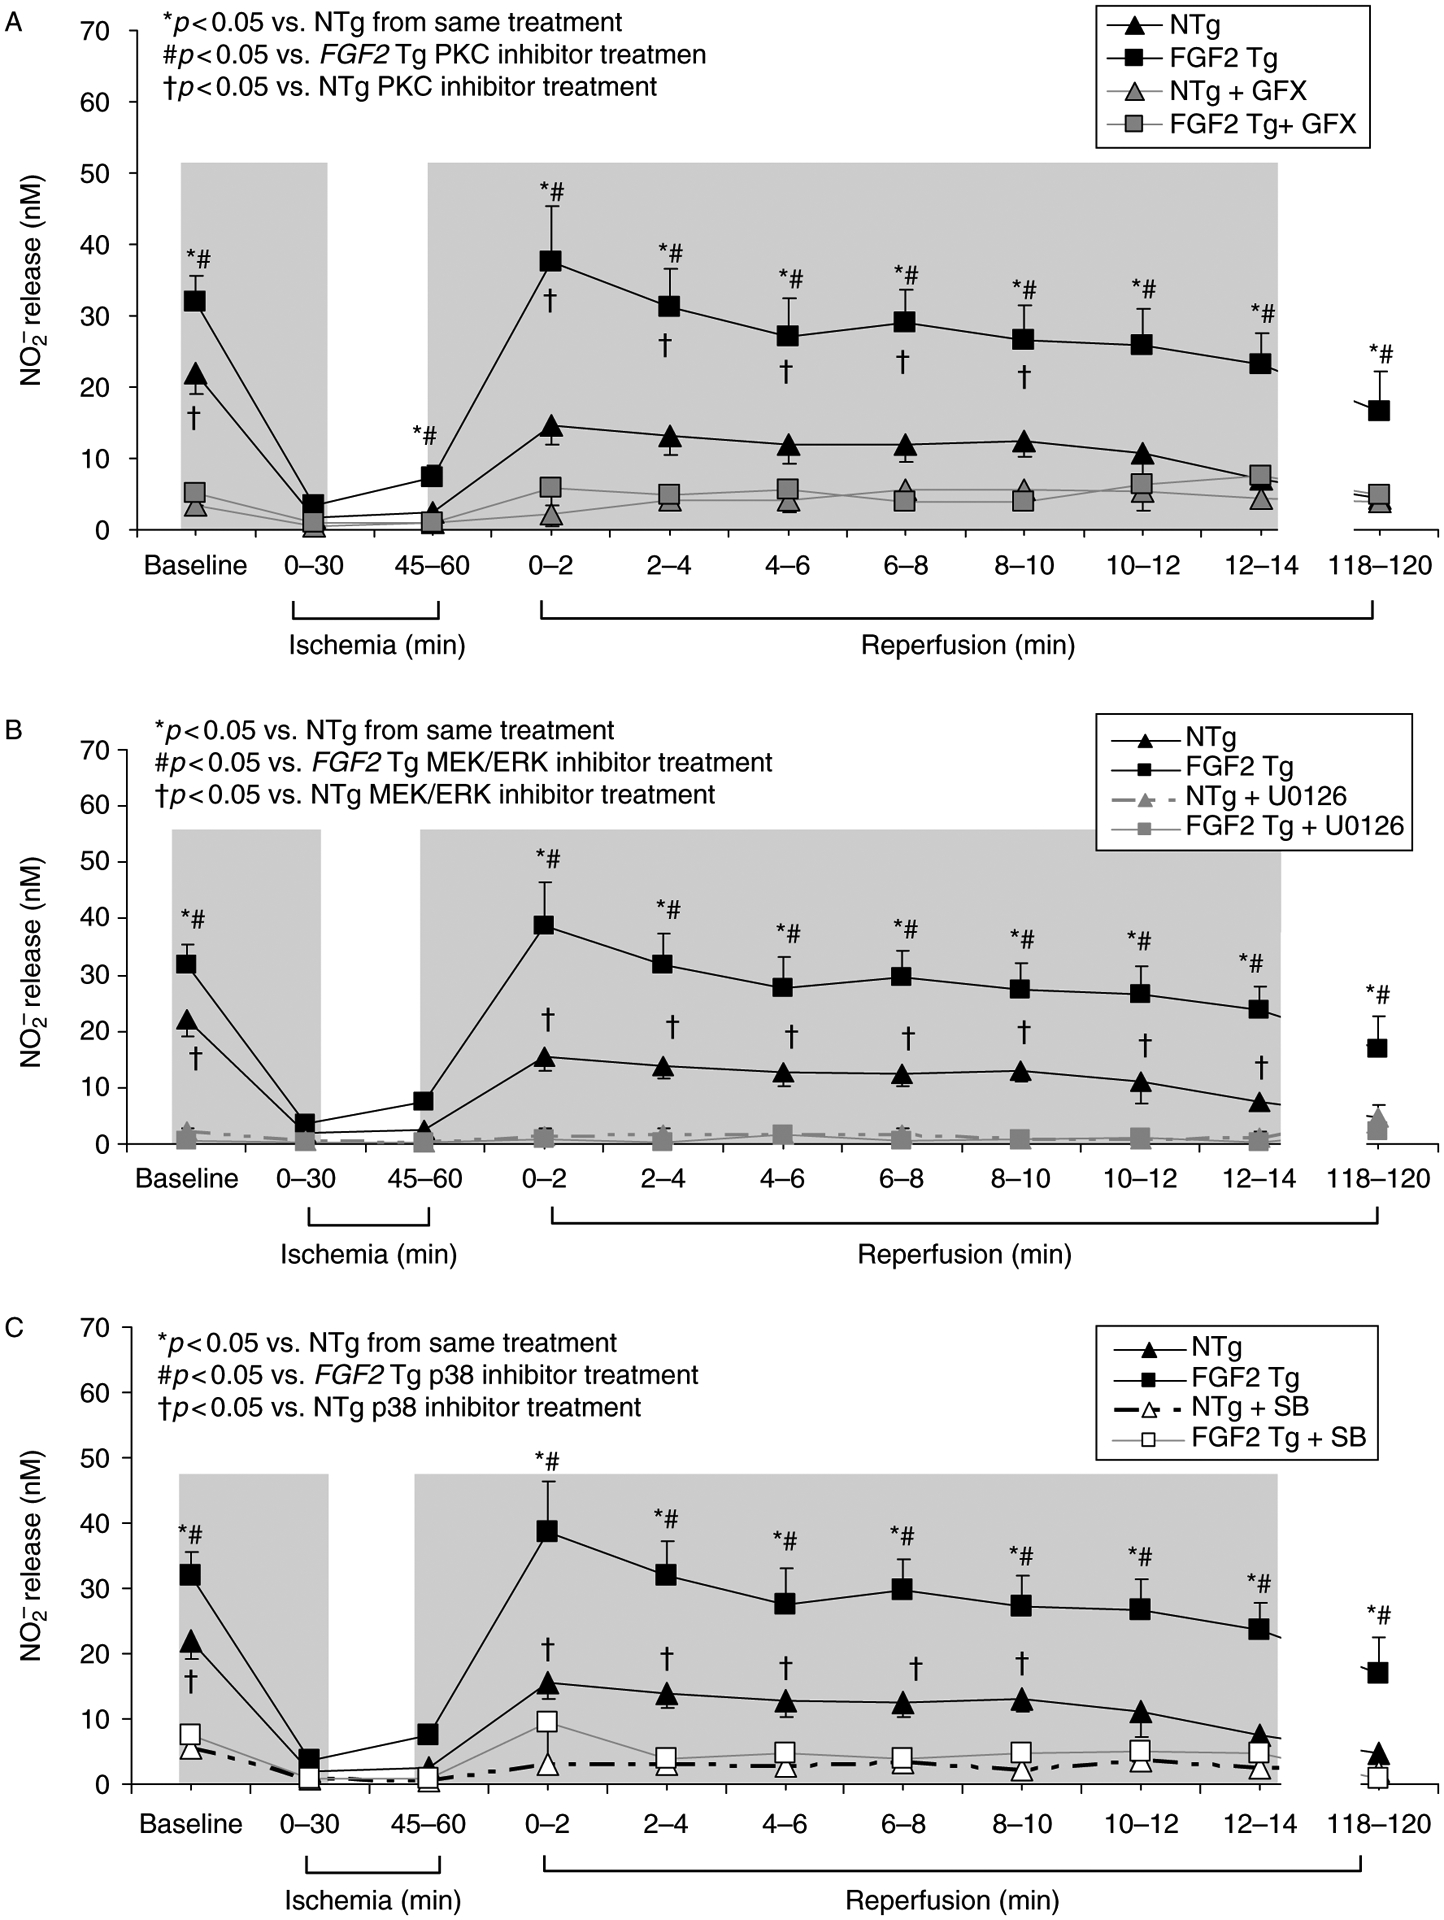
Figure 5.

Effect of NO release, as measured by nitrite levels in vehicle- and protein kinase (PKC, ERK or p38) inhibitor-treated NTg and FGF2 Tg hearts. Nitrite release was significantly elevated in FGF2 Tg hearts compared to NTg hearts. PKC inhibition (GFX treatment, 1 μM) resulted in a decreased level of nitrite release in both FGF2 Tg and NTg hearts, indicating that NOS activity was regulated by PKC signaling (A). MEK/ERK inhibition (U0126, 2.5 μM) (B) or p38 inhibition (SB203580, 2 μM) (C) resulted in a decreased level of nitrite release in both FGF2 Tg and NTg hearts, indicating that NOS activity was inhibited and that protein kinases regulate NOS activity and NO production leading to protection against I-R injury. NTg, black triangle; NTg + GFX, gray triangle; NTg + U0126, gray triangle/dashed gray line; NTg + SB, open triangle/dashed line; FGF2 Tg, black square; FGF2 Tg + GFX, gray square; FGF2 Tg + U0126, gray square/dashed gray line; and FGF2 Tg + SB, open square/gray line. Gray region, time points of inhibitor treatment (15 min prior to through first 15 minutes of ischemia and last 15 minutes of ischemia through first 15 min of reperfusion). n = 6–11 hearts per group. *p < 0.05 vs. NTg from same treatment. #p < 0.05 vs. FGF2 Tg protein kinase inhibitor treatment. †p < 0.05 vs. NTg protein kinase inhibitor treatment.
