Figure 3.
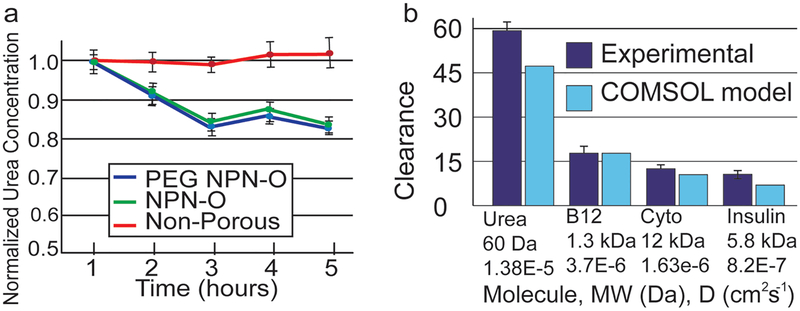
Single-pass clearance data and static microdialysis results a) Single-pass urea clearance on single-membrane dialysis device (610 μm analyte channels). Protein fouling by serum is evaluated over dialysis window by measuring urea clearance in a single-pass over the membrane in a background of 100% serum. NPN-O and PEG-NPN-O showed a steady and almost identical 20% reduction in urea, while a nonporous control shows no reduction in urea concentration. b) Single-pass clearance with optimized two-membrane device (310 μm analyte channels). The two separate values of urea clearance are accounted for by the differences in the devices and flow rates used. Clearance decreases as the diffusion coefficients decrease (Durea = 1.38E-5,[47] DB12 = 3.7E-6,[48] DCyto = 1.63E-6,[26] DInsulin = 8.2E-7[25]). Results are closely predicted by COMSOL model.

