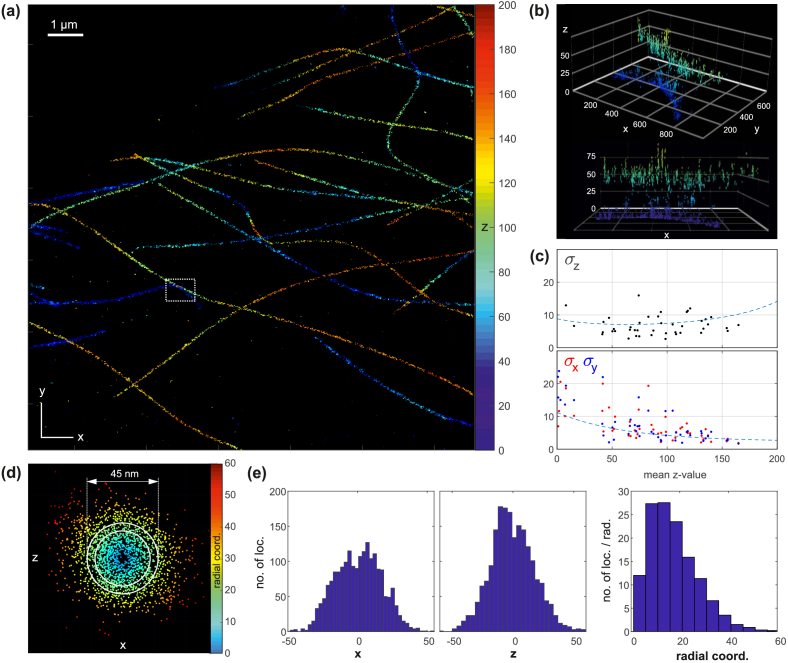
Fig. 7.
Experimental results from dSTORM measurements on stained microtubules (Alexa 647) in COS7 cells. (a) 3D localization map; z-positions are color-coded. (b) Detailed 3D views of the region marked with the white box. Every localization is represented by a 3D Gaussian blob whose widths correspond to the respective CRLB precision values. (c) Evaluation of localization precisions for molecules which repeatedly appear in successive camera frames. The dashed lines mark the CRLB-based theoretical precisions. (d) The projection of localizations along several short microtubule sections reveals their hollow core. Two white circles bound the region of expected fluorophore positions. (e) Histograms of x-, z- and radial coordinates of the molecule positions shown in (d). The x- and z- histograms show a weak minimum in the center. The radial histogram clearly reveals a depletion of localization events near the core. All numbers in the figure are in nm if not stated otherwise.

