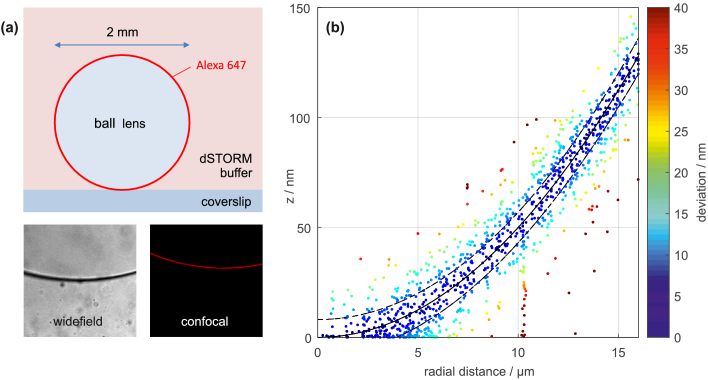
Fig. 8.
Calibration measurement on a dye-coated ball lens. (a) Graphical explanation of the sample geometry and widefield and confocal fluorescence images of the sphere. (b) Results from an off-focus dSTORM measurement. The ground truth is marked by the solid black line. The dashed lines mark the standard deviation calculated from the CRLB.

