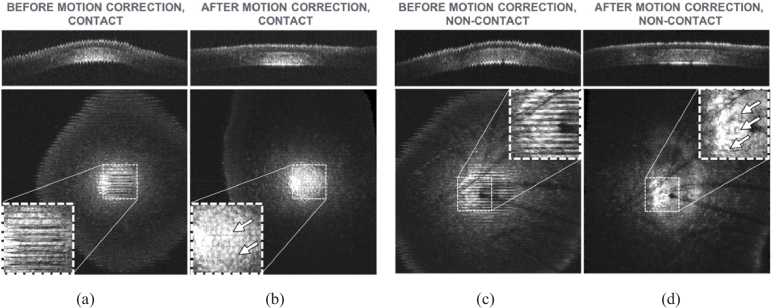
Fig. 3.
Effects of motion during contact (a) and non-contact (c) imaging of mice cornea in vivo, and recovery of cellular resolution after motion correction (contact (b) and non-contact (d)). The field of view is 1 × 1 mm2. Top figures = C-scans; bottom figures = en face views taken at the endothelium, the single layer of cells lining the posterior surface of the cornea; insets = magnified view showing amplitude of motion artifacts. Arrows in the insets on the en face views indicate endothelial cells. Images are brightest at the center due to the natural curvature of the cornea, which produces a stronger reflection at the center than at the periphery. The dark features in the non-contact images (c-d) are caused by mouse whiskers obscuring the view.

