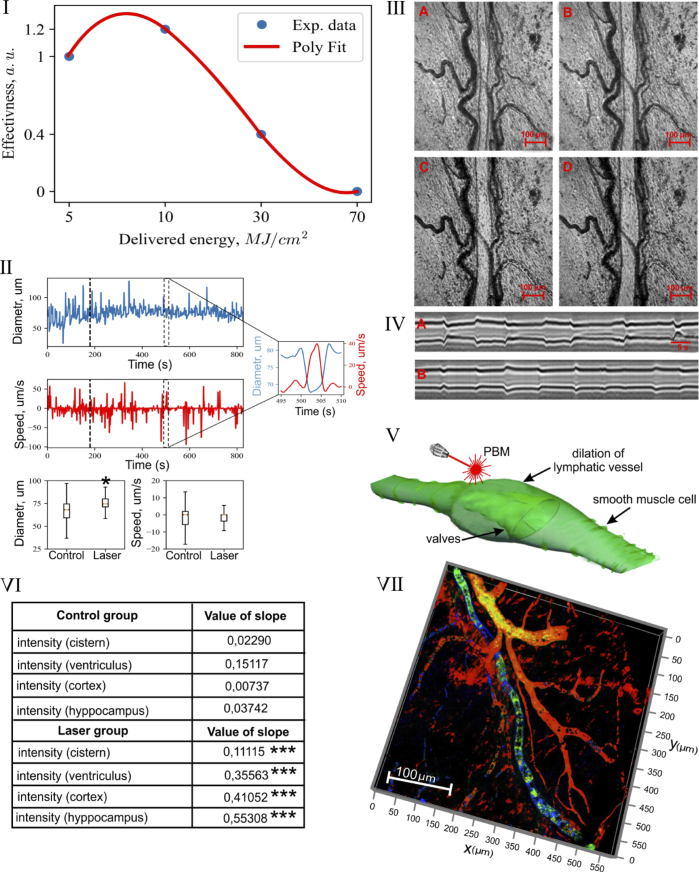
Fig. 2.
The PBM of lymphatic tone and contraction: I – PBM-dose related changes in tone of the mesenteric lymphatic vessels; II – The changes in diameter (um) of the mesenteric lymphatic vessels and lymph flow (um/sec) in them before and after tPBM (10 J/cm2); III - The illustration of changes in diameter of the mesenteric lymphatic vessel in systole (A) and diastole (C) before (A and C) after (B and D) PBM (10 J/cm2), scale bars are 100 µm (see also Visualization 1); IV – The time-related changes of diameter of the mesenteric lymphatic vessels before (A) and after (B) PBM (10 J/cm2), scale bars are 5 µm; V – Schematic illustration of PBM-mediated relaxation of the mesenteric lymphatic vessel; VI - The OCT monitoring of the rate of accumulation of GNRs in dcLN in untreated mice and in mice received tPBM (64 J/cm2 via the intact skull and 10 J/cm2 on the brain surface) after GNRs injection into the cisterna magna, the right lateral ventricle, the cortex, the hippocampus; *** - p < 0.001 vs. basal level. n = 10 in each group; VII – The illustration of clearance of FITC-dextran (green color) from the brain via MLVs (blue color), which are located close to the cerebral veins (red color, labeled by NG2).

