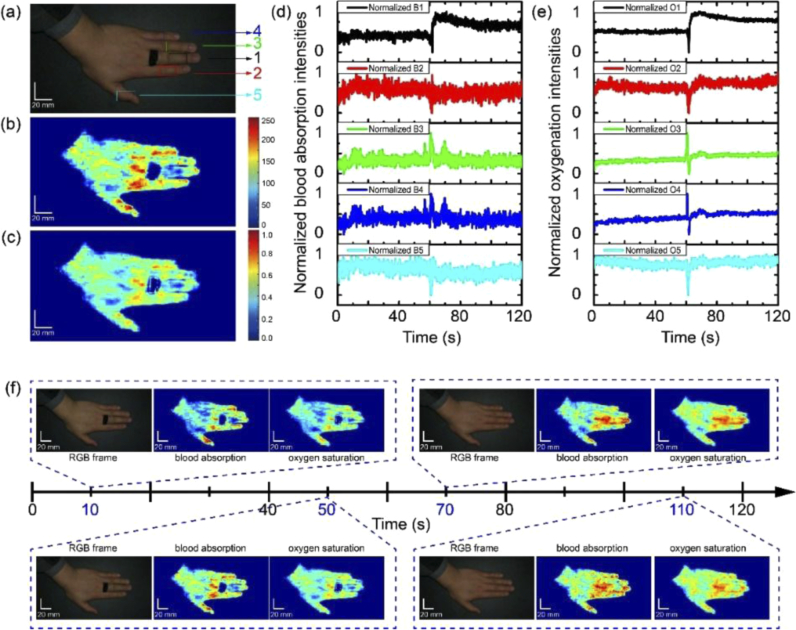
Fig. 7.
Vascular occlusion monitoring with the smartphone-based hyperspectral imaging system. (a) Representative RGB frame at 60s from the monitoring video during vascular occlusion on the middle finger. (b) Blood absorption map at 60s extracted from hyperspectral reconstruction based on the RGB frame in (a) (color-coded according to color bar shown in the right). (c) Oxygen saturation map at 60s extracted from hyperspectral reconstruction based on the RGB frame in (a) (color-coded according to color bar shown in the right). (d) Real-time response curves of blood absorption intensities on middle finger during vascular occlusion. The intensities were normalized summations of blood absorption intensities in corresponding color box areas in (a): Experiment group: black curve: box 1, mid-finger. Control group: red curve: box 2, forefinger; green curve: box 3, index finger; blue curve: box 4, little finger; teal curve: box 5, thumb. (e) Real-time response curves of oxygen saturation intensities on finger skins during vascular occlusion. The intensities were normalized summations of oxygen saturation intensities in corresponding color box areas in (a). Experiment group: black curve: box 1, mid-finger. Control group: red curve: box 2, forefinger; green curve: box 3, index finger; blue curve: box 4, little finger; teal curve: box 5, thumb). (f) Visualization of RGB frames, blood absorption maps and oxygen saturation maps at 10s, 50s, 70s and 110s from the monitoring video to vascular occlusion on middle finger. Blood absorption maps were color-coded according to color bar shown in (b). Oxygen saturation maps were color-coded according to color bar shown in (c).

